Where E-Rate dollars go, district by district and school by school.

Funding reports built from USAC open data: total subsidies, discount rates, top recipients and service providers for every congressional district, plus school-level directories for every state. A data project of the Technology Policy Institute of Washington, D.C.

$2.37B
FY2025
157,801
Recipients
25,161
BEN reports
440
District reports

Schools & Libraries — Find Yours

Browse all 25,161 billed entities (school districts, library systems, consortia) alphabetically.

Schools & Libraries — State Reports

View by school →View by congressional district →

One PDF per state or region covering every billed entity and recipient site — FY1998–2025 where available.
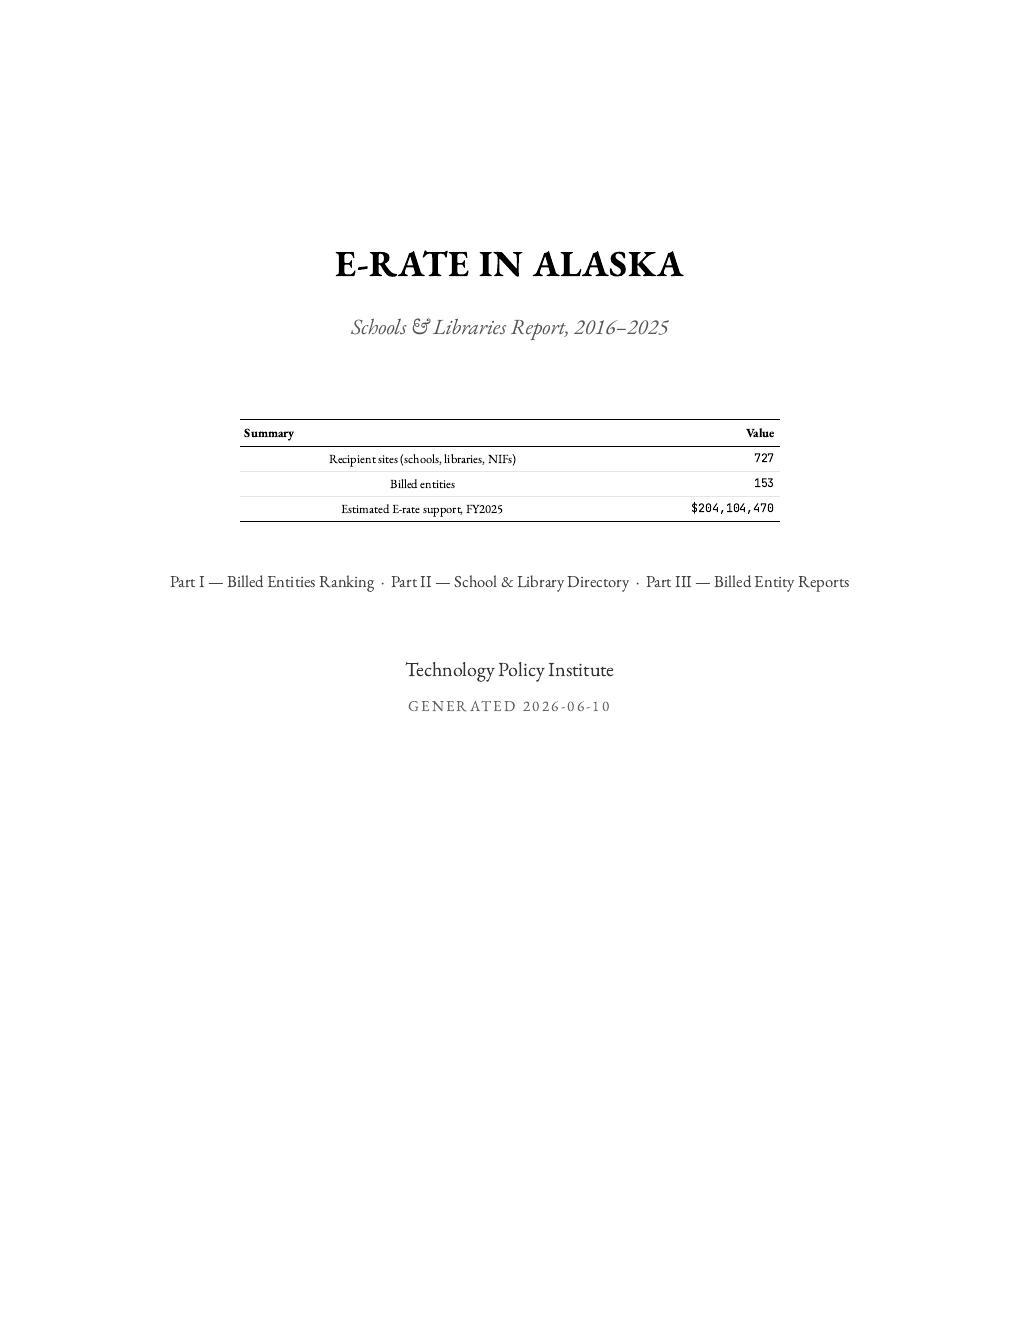
Alaska report cover
Alaska
322 pages · 727 recipient sites
↓ Download PDFBrowse online →
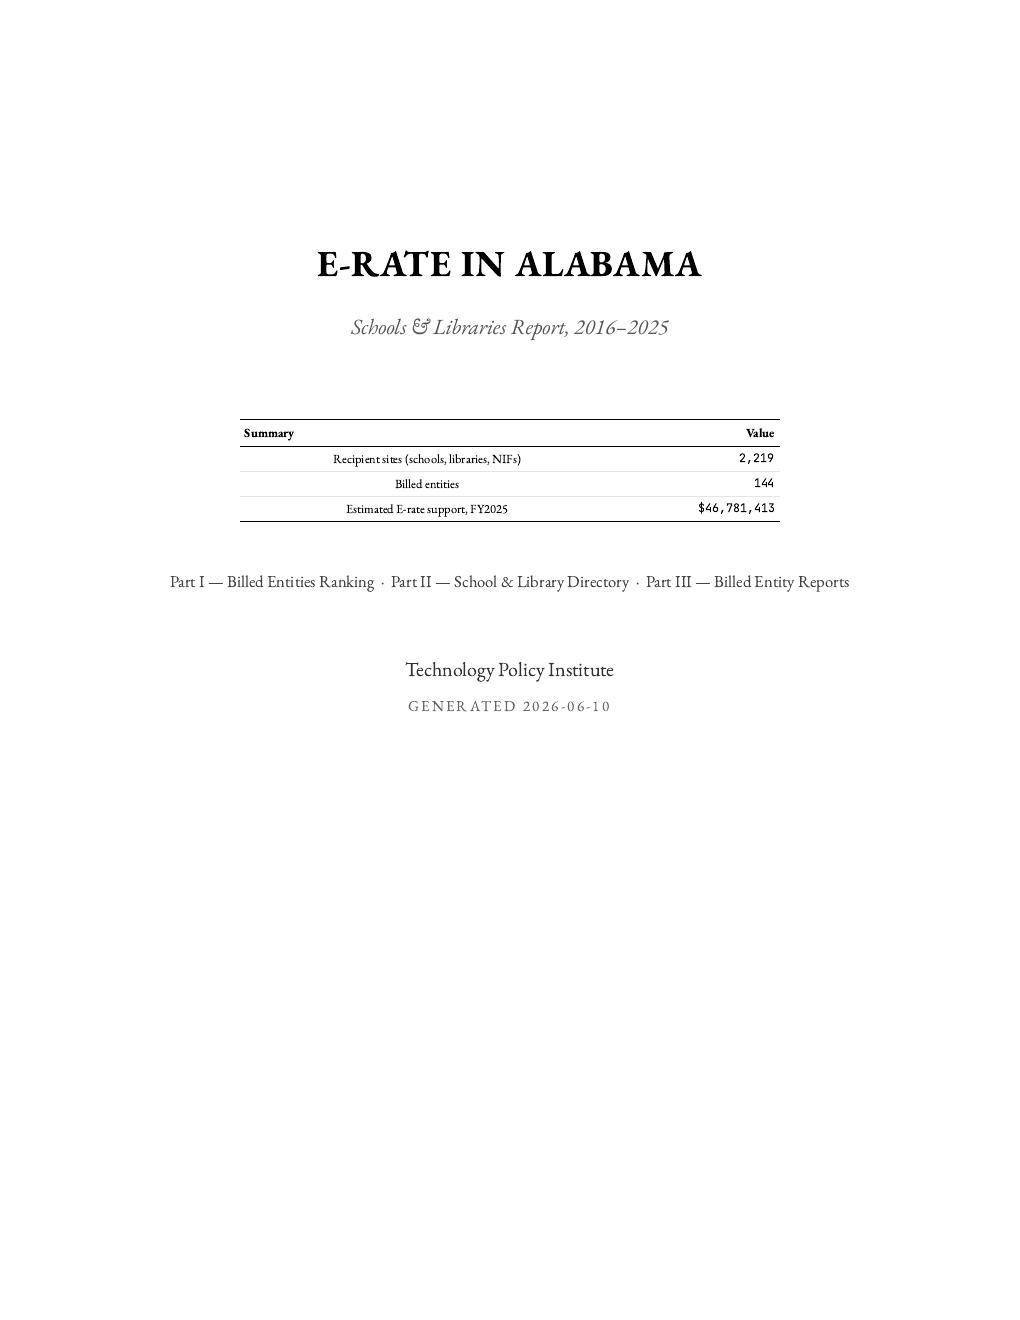
Alabama report cover
Alabama
473 pages · 2,219 recipient sites
↓ Download PDFBrowse online →
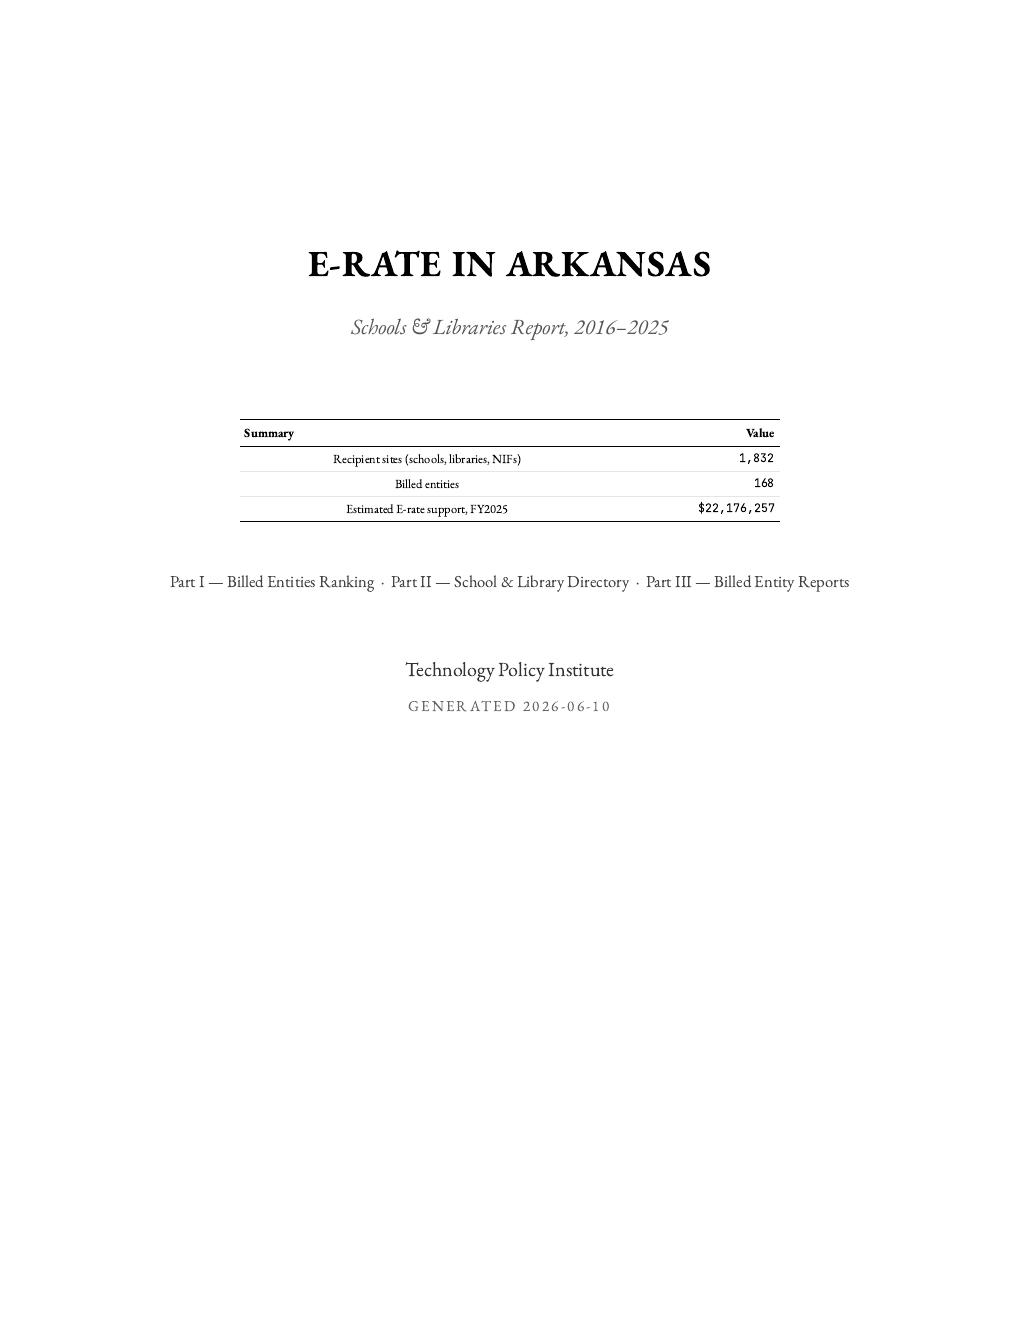
Arkansas report cover
Arkansas
453 pages · 1,832 recipient sites
↓ Download PDFBrowse online →
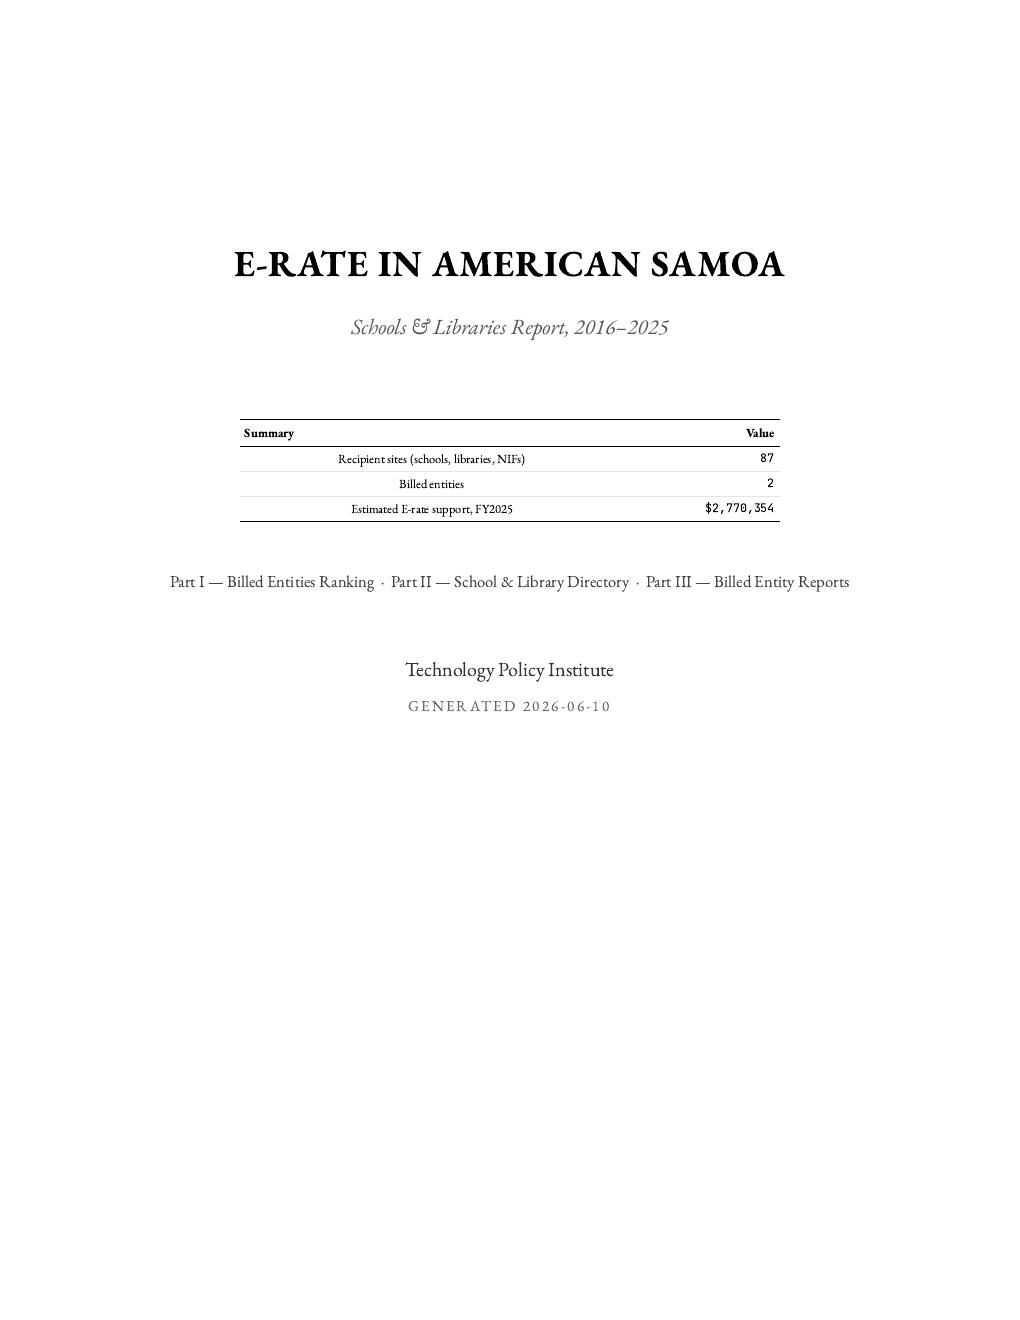
American Samoa report cover
American Samoa
13 pages · 87 recipient sites
↓ Download PDFBrowse online →
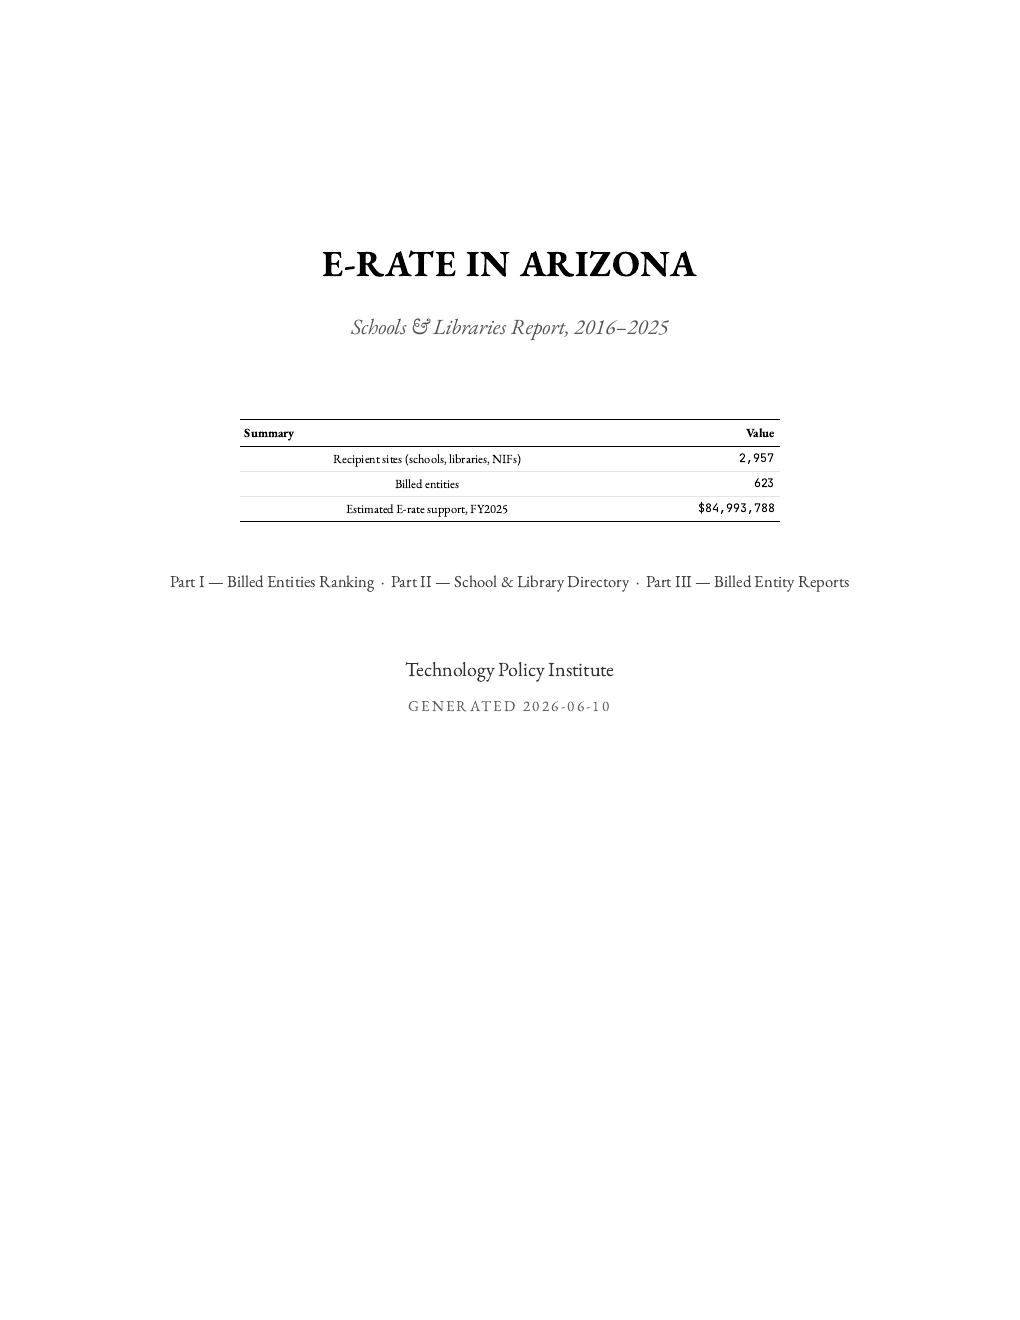
Arizona report cover
Arizona
1,392 pages · 2,957 recipient sites
↓ Download PDFBrowse online →
California — Central report cover
California — Central
674 pages · 2,174 recipient sites
↓ Download PDFBrowse online →
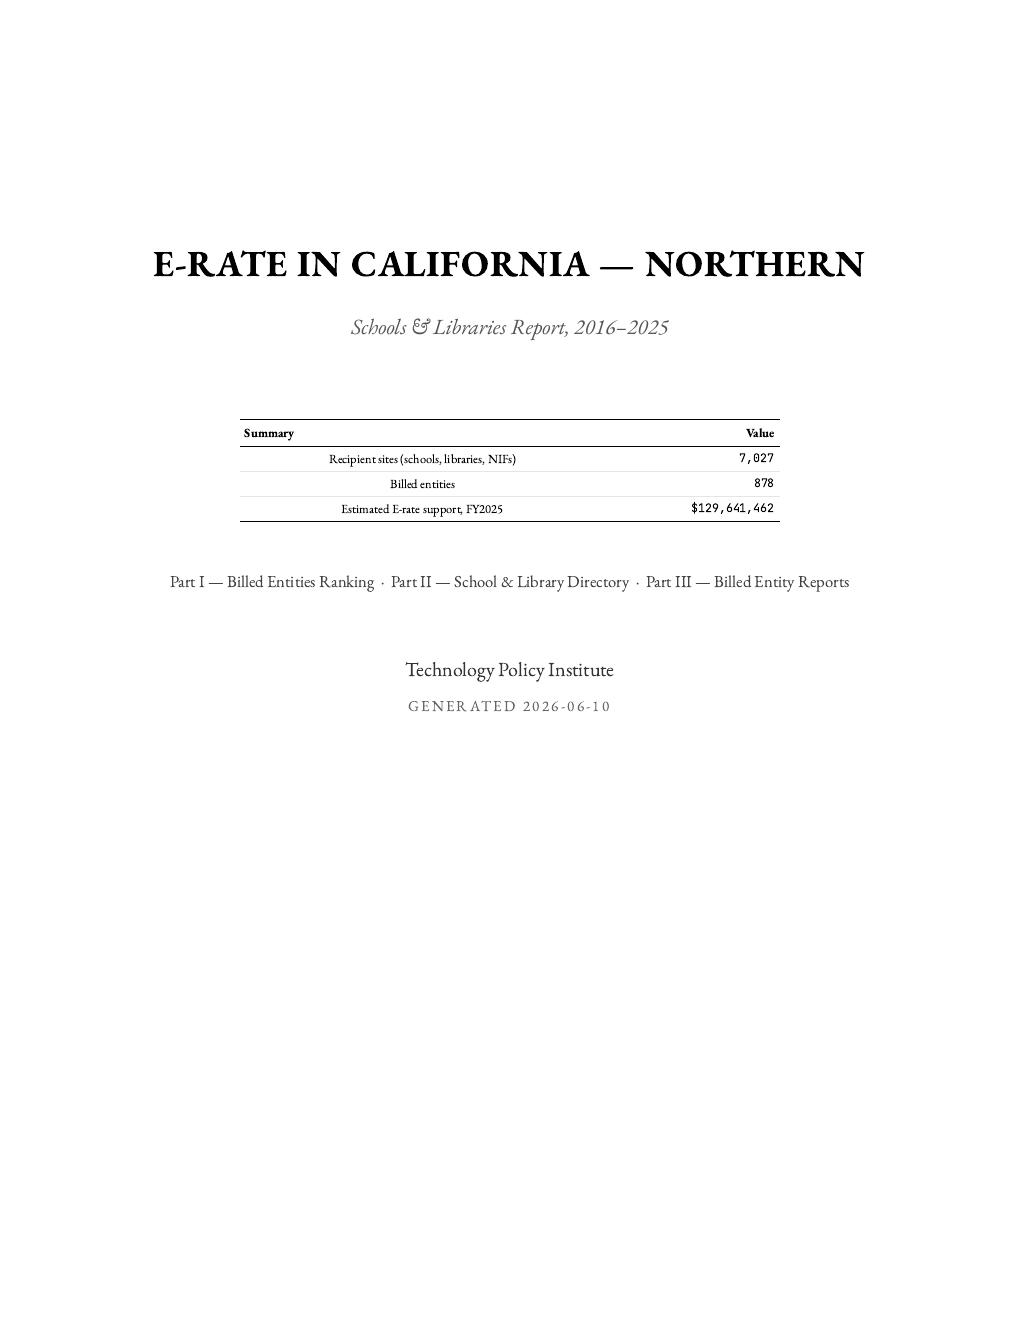
California — Northern report cover
California — Northern
2,281 pages · 7,027 recipient sites
↓ Download PDFBrowse online →
California — Southern report cover
California — Southern
2,267 pages · 8,452 recipient sites
↓ Download PDFBrowse online →
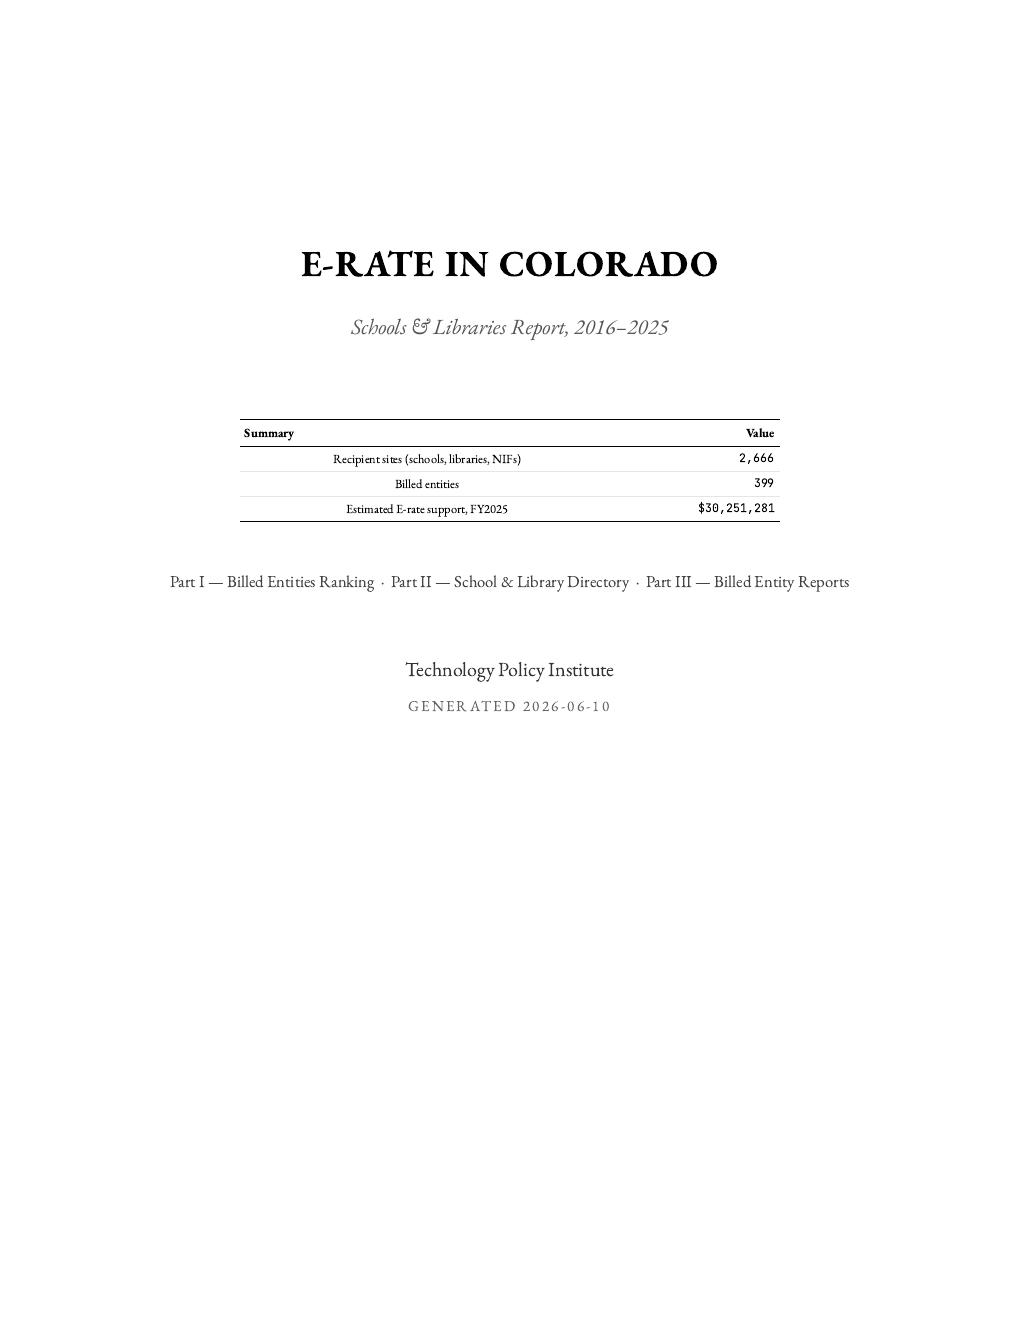
Colorado report cover
Colorado
961 pages · 2,666 recipient sites
↓ Download PDFBrowse online →
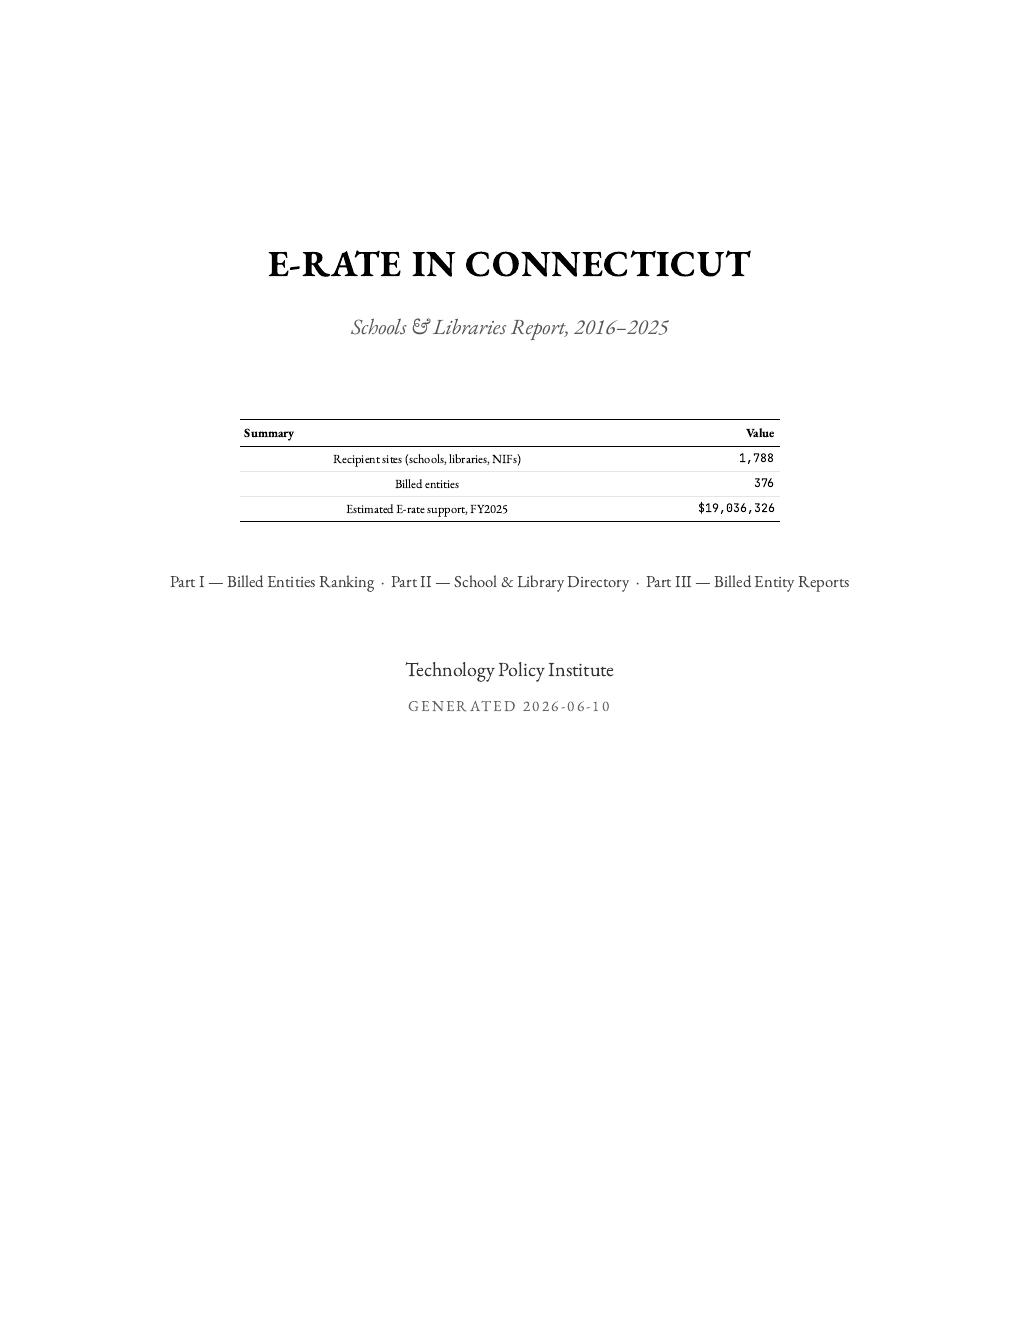
Connecticut report cover
Connecticut
883 pages · 1,788 recipient sites
↓ Download PDFBrowse online →
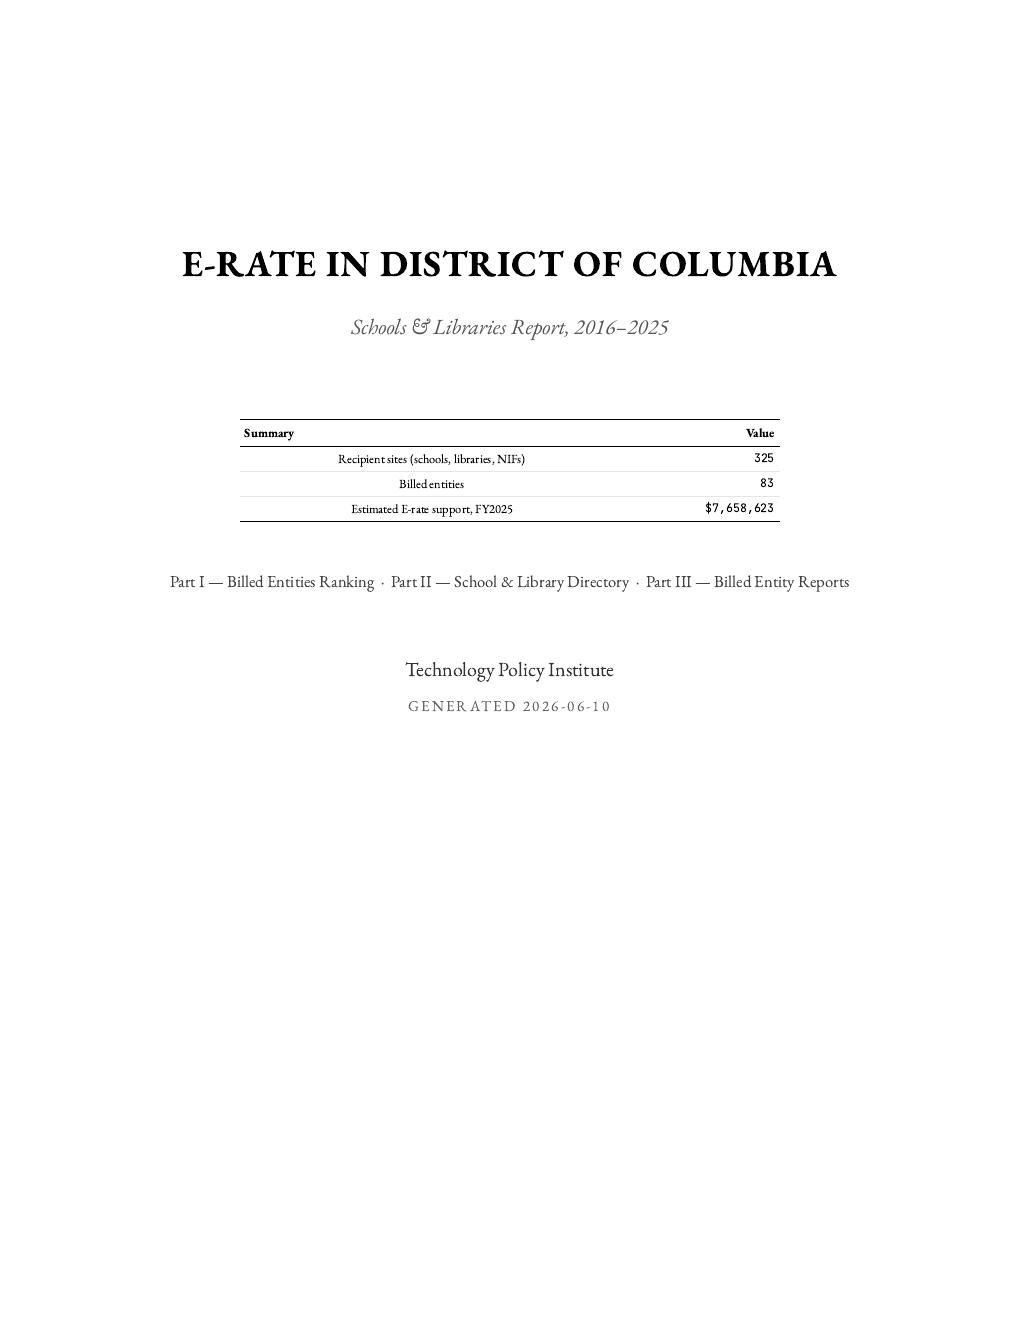
District of Columbia report cover
District of Columbia
152 pages · 325 recipient sites
↓ Download PDFBrowse online →
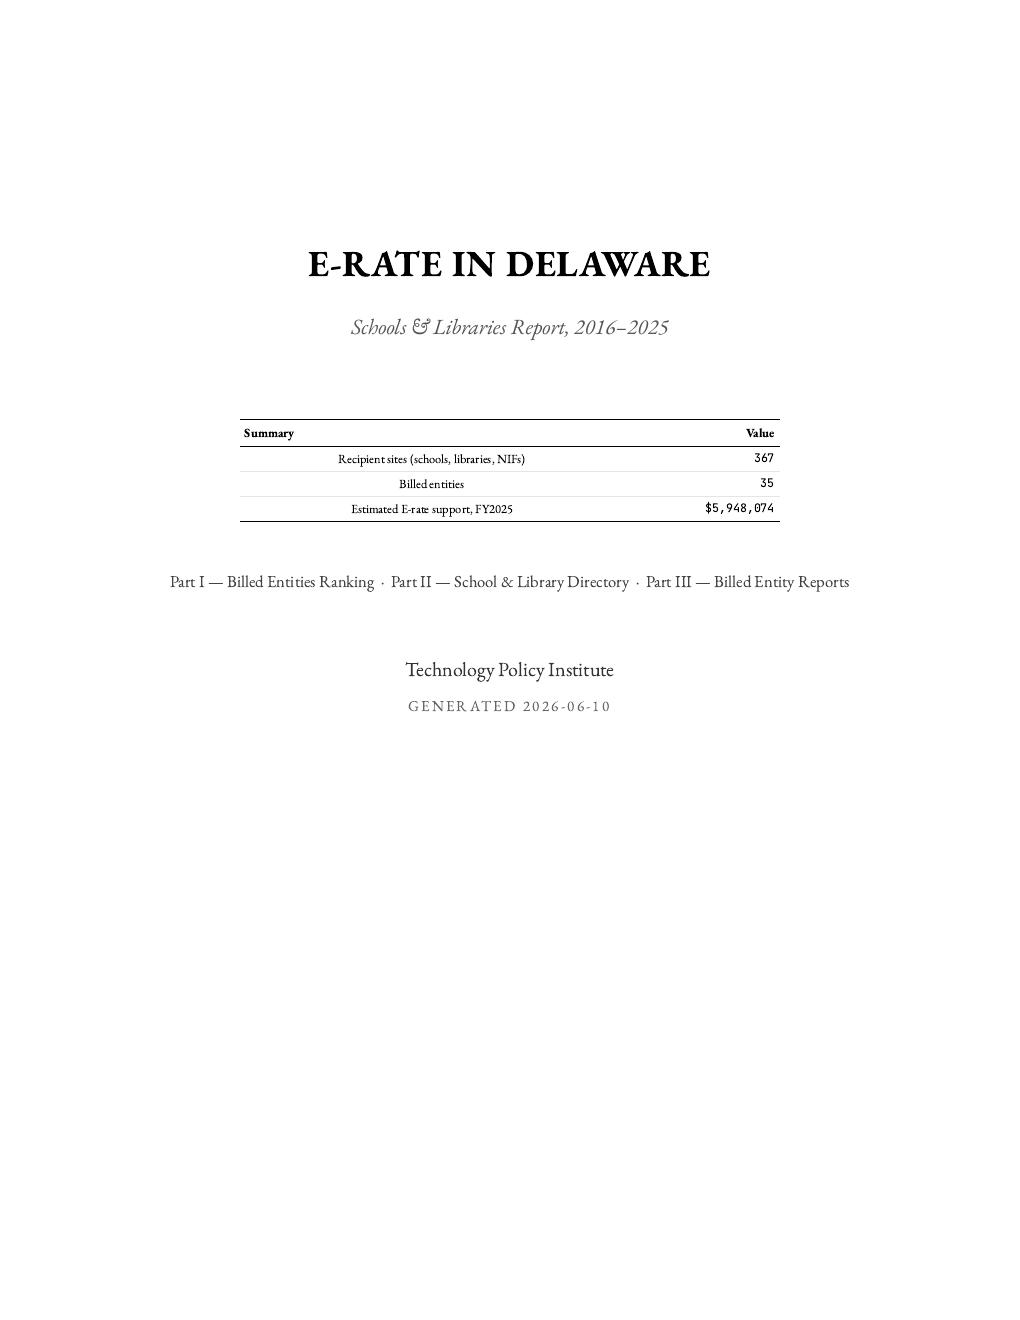
Delaware report cover
Delaware
100 pages · 367 recipient sites
↓ Download PDFBrowse online →
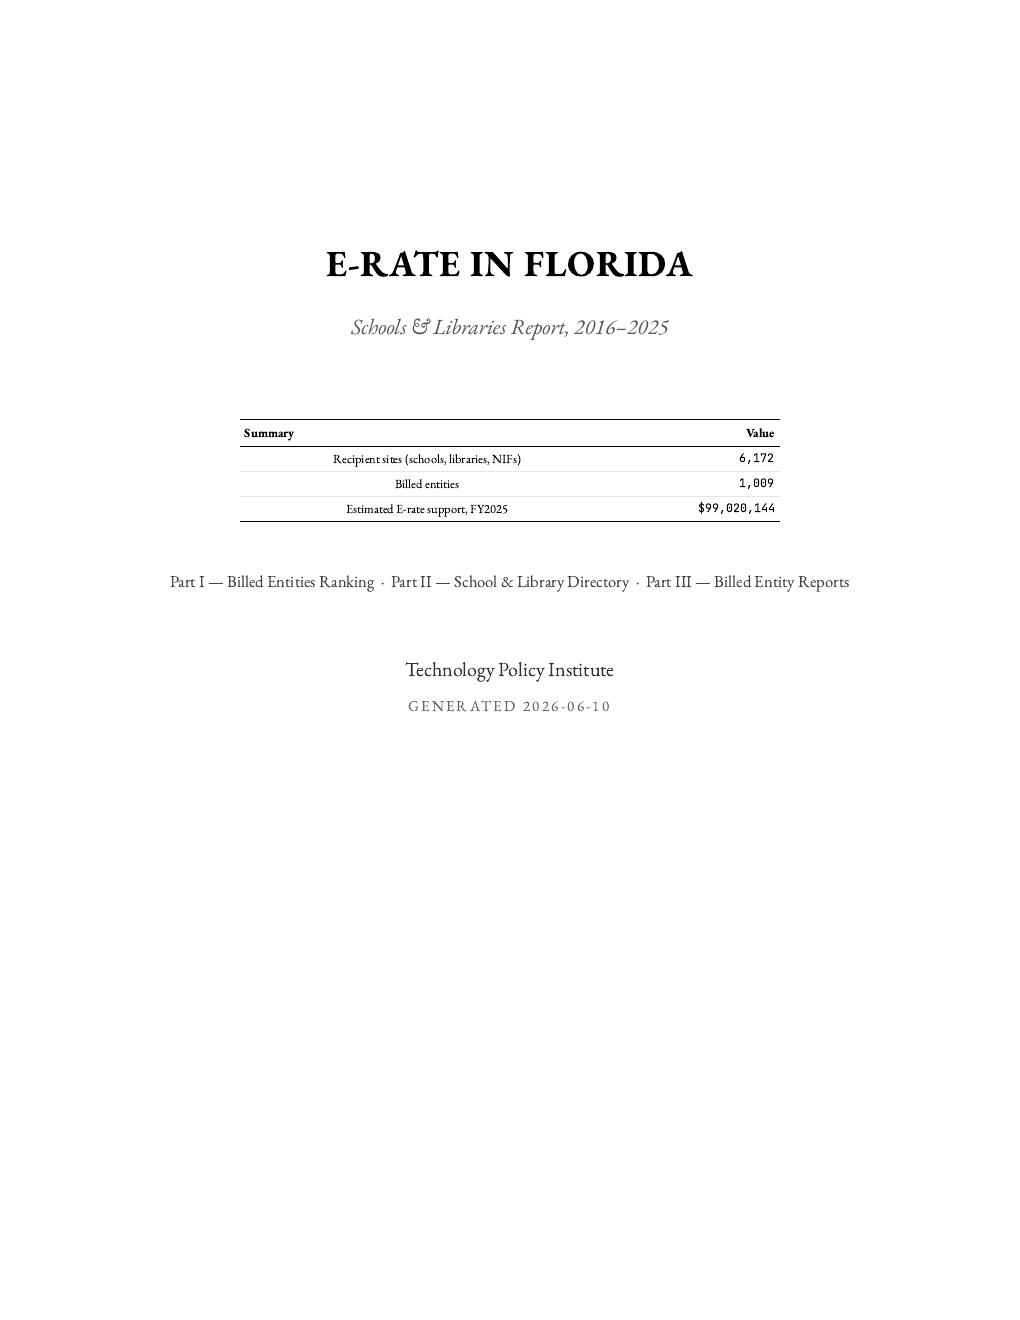
Florida report cover
Florida
1,978 pages · 6,172 recipient sites
↓ Download PDFBrowse online →
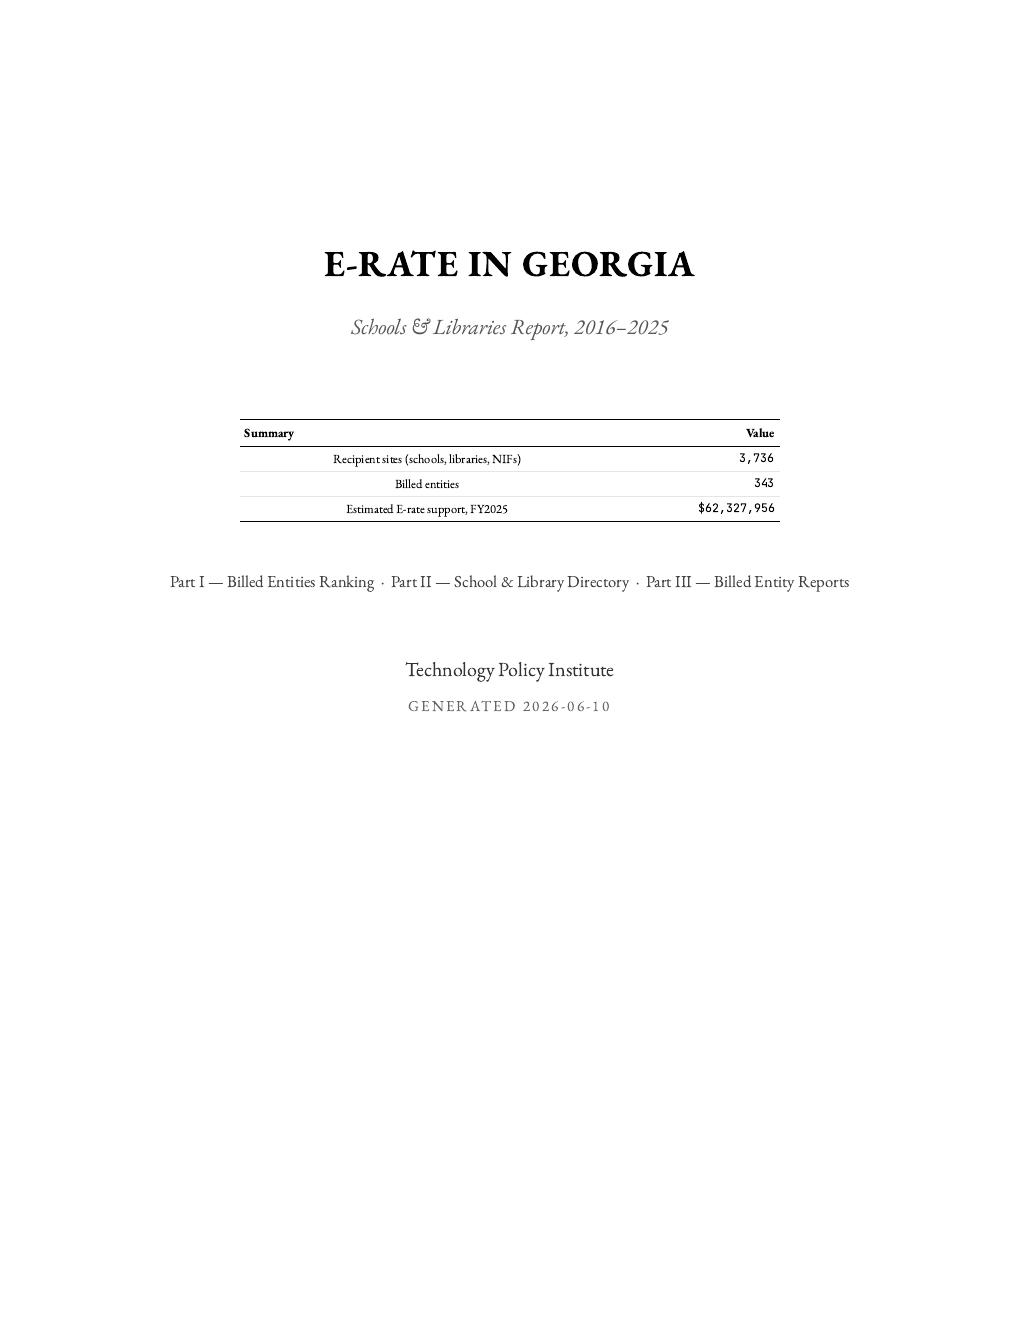
Georgia report cover
Georgia
1,014 pages · 3,736 recipient sites
↓ Download PDFBrowse online →
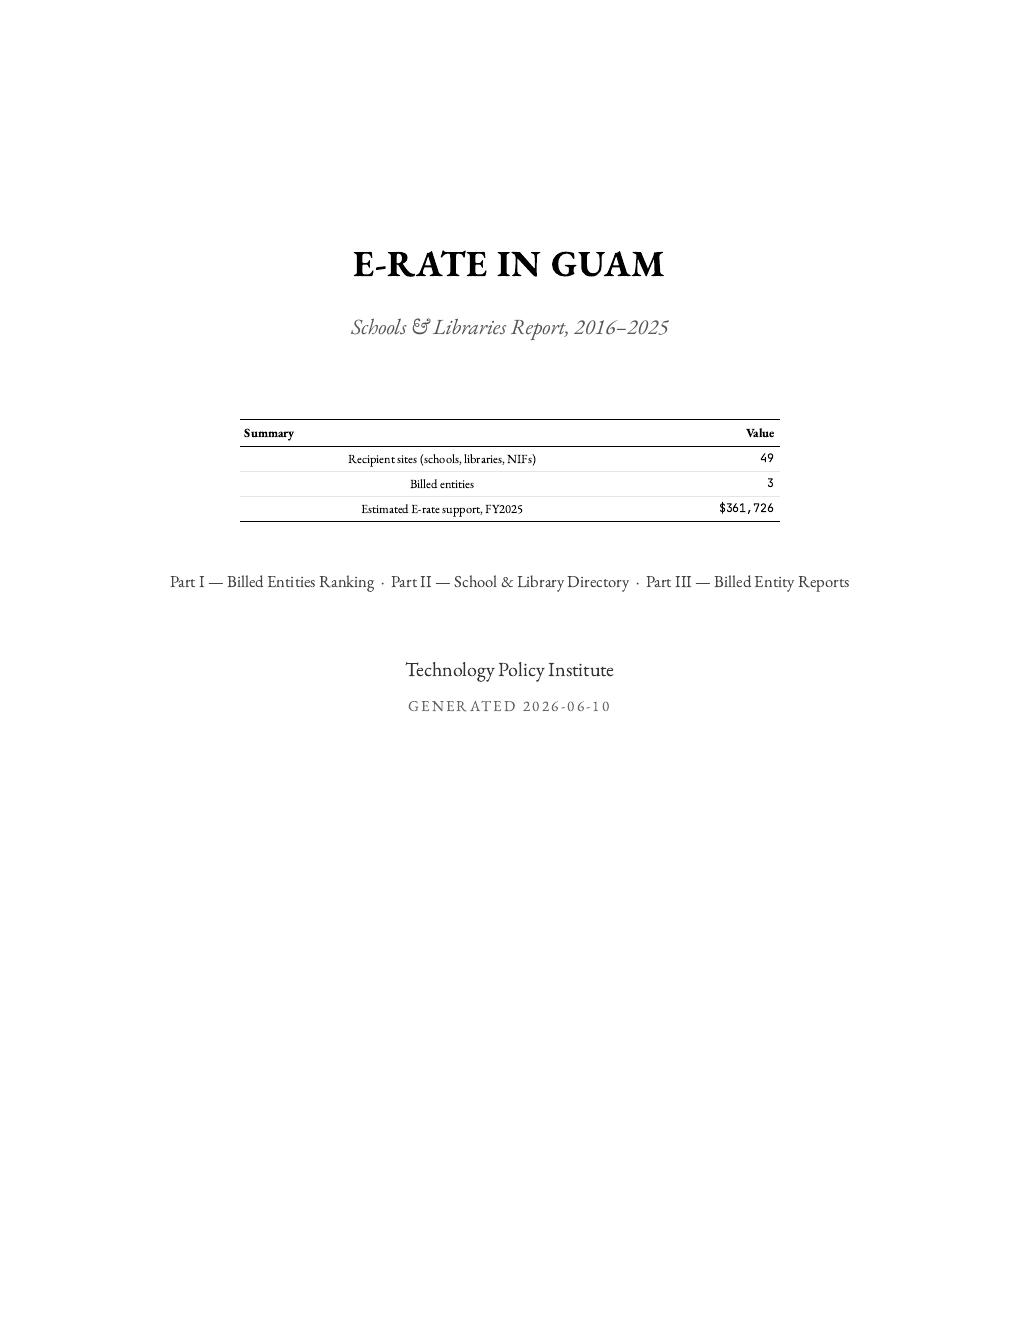
Guam report cover
Guam
14 pages · 49 recipient sites
↓ Download PDFBrowse online →
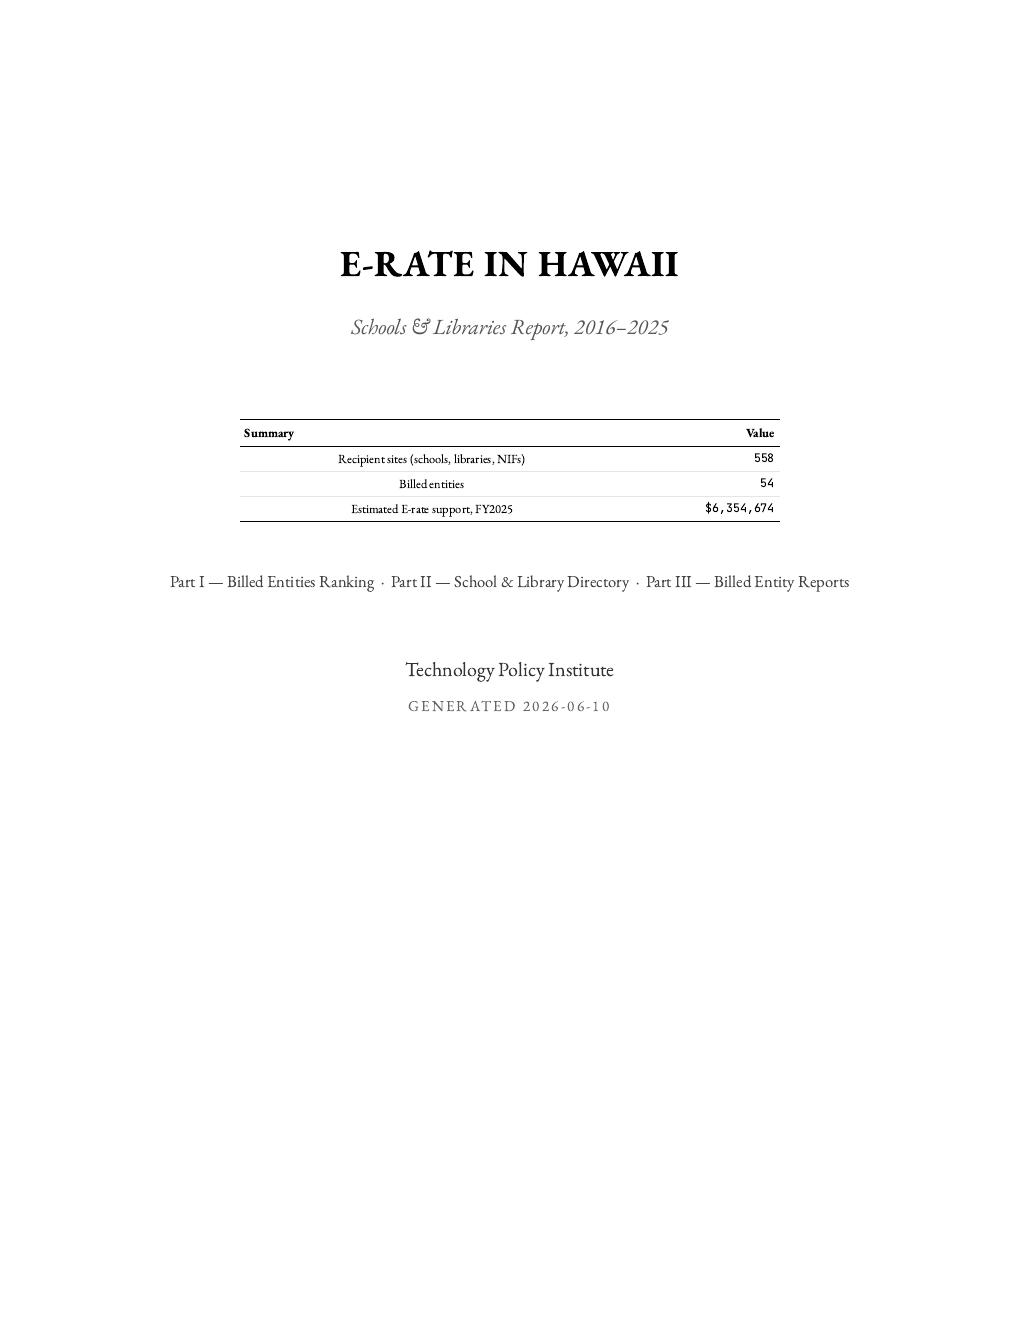
Hawaii report cover
Hawaii
125 pages · 558 recipient sites
↓ Download PDFBrowse online →
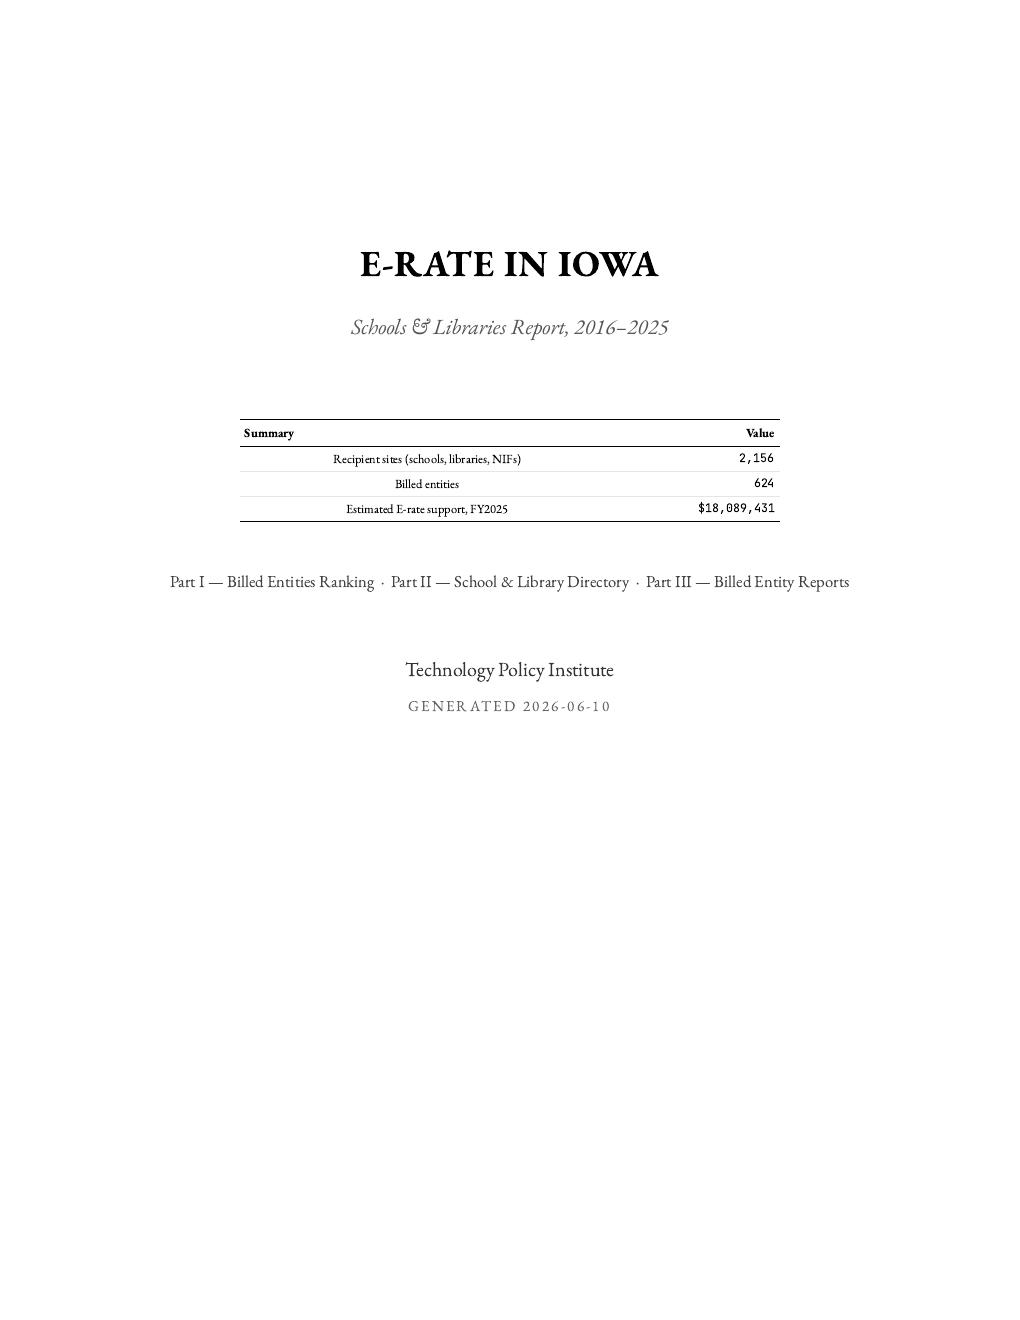
Iowa report cover
Iowa
1,551 pages · 2,156 recipient sites
↓ Download PDFBrowse online →
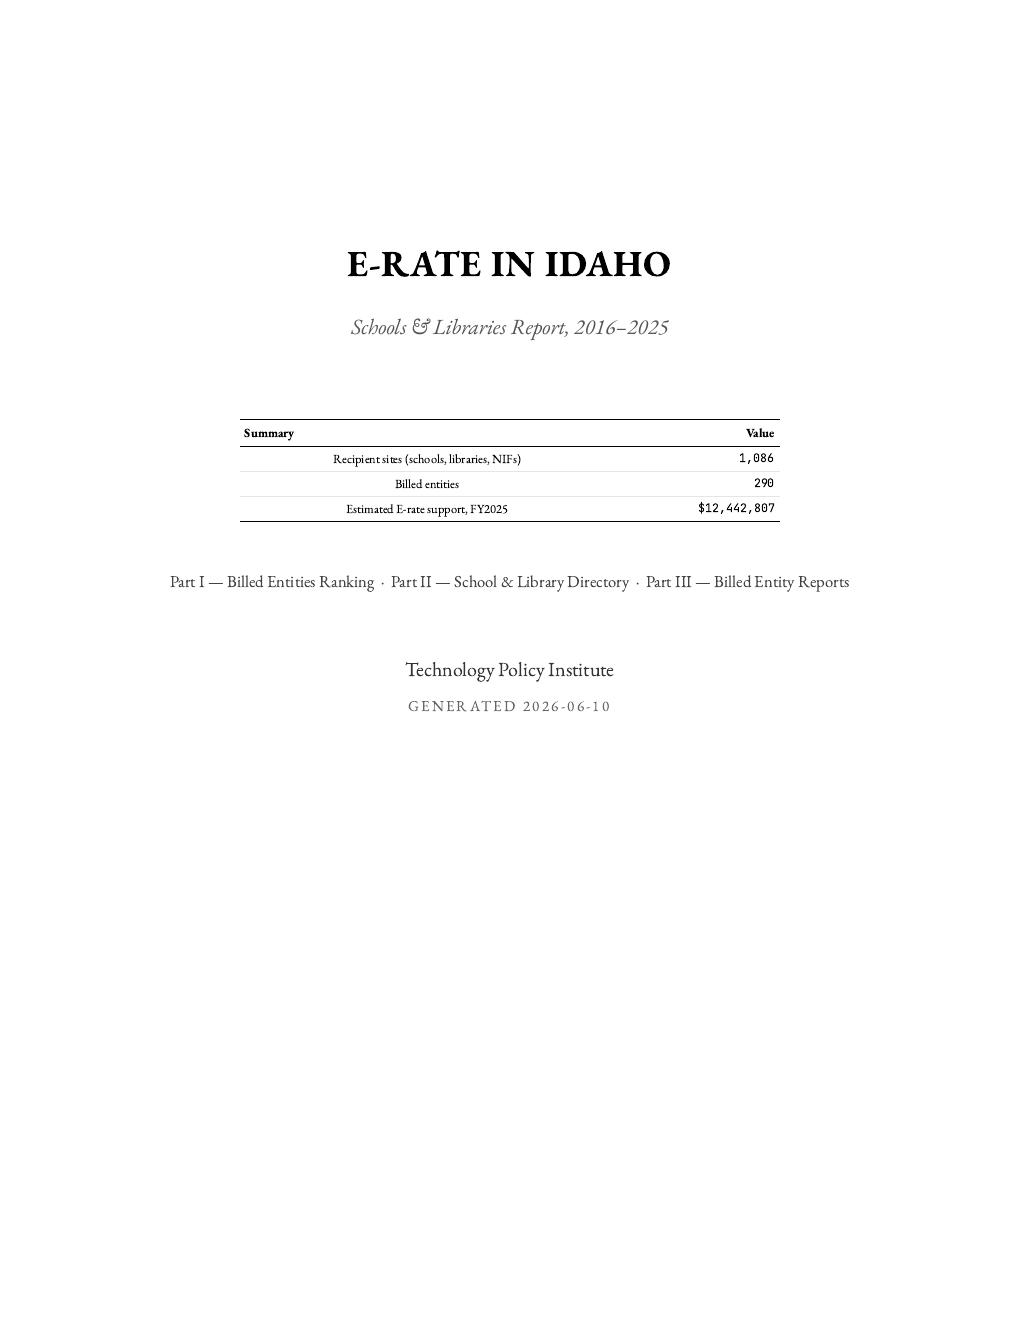
Idaho report cover
Idaho
627 pages · 1,086 recipient sites
↓ Download PDFBrowse online →
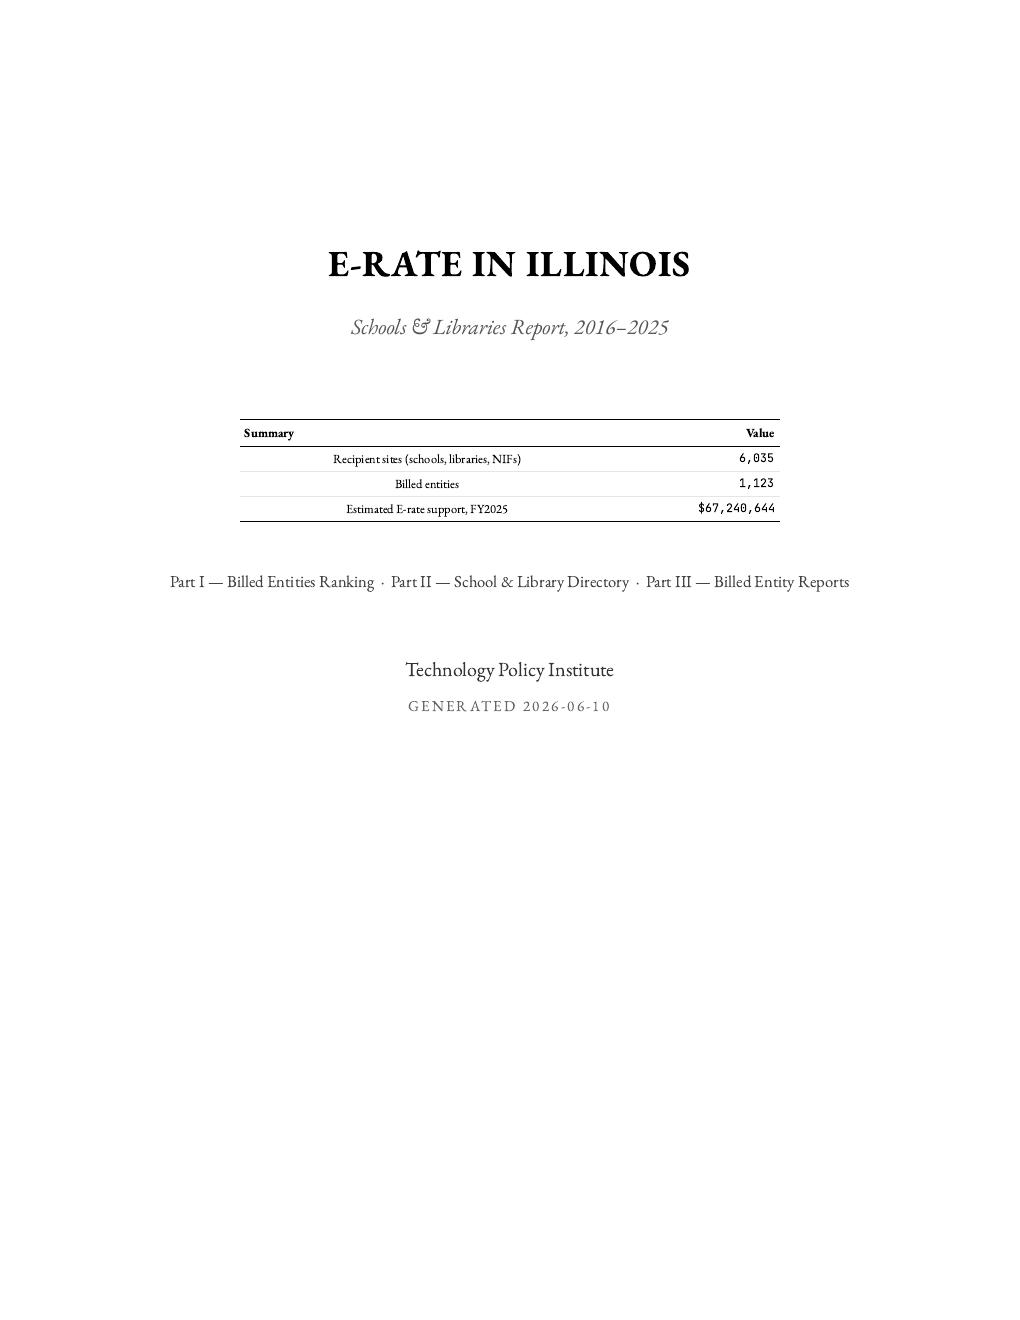
Illinois report cover
Illinois
2,766 pages · 6,035 recipient sites
↓ Download PDFBrowse online →
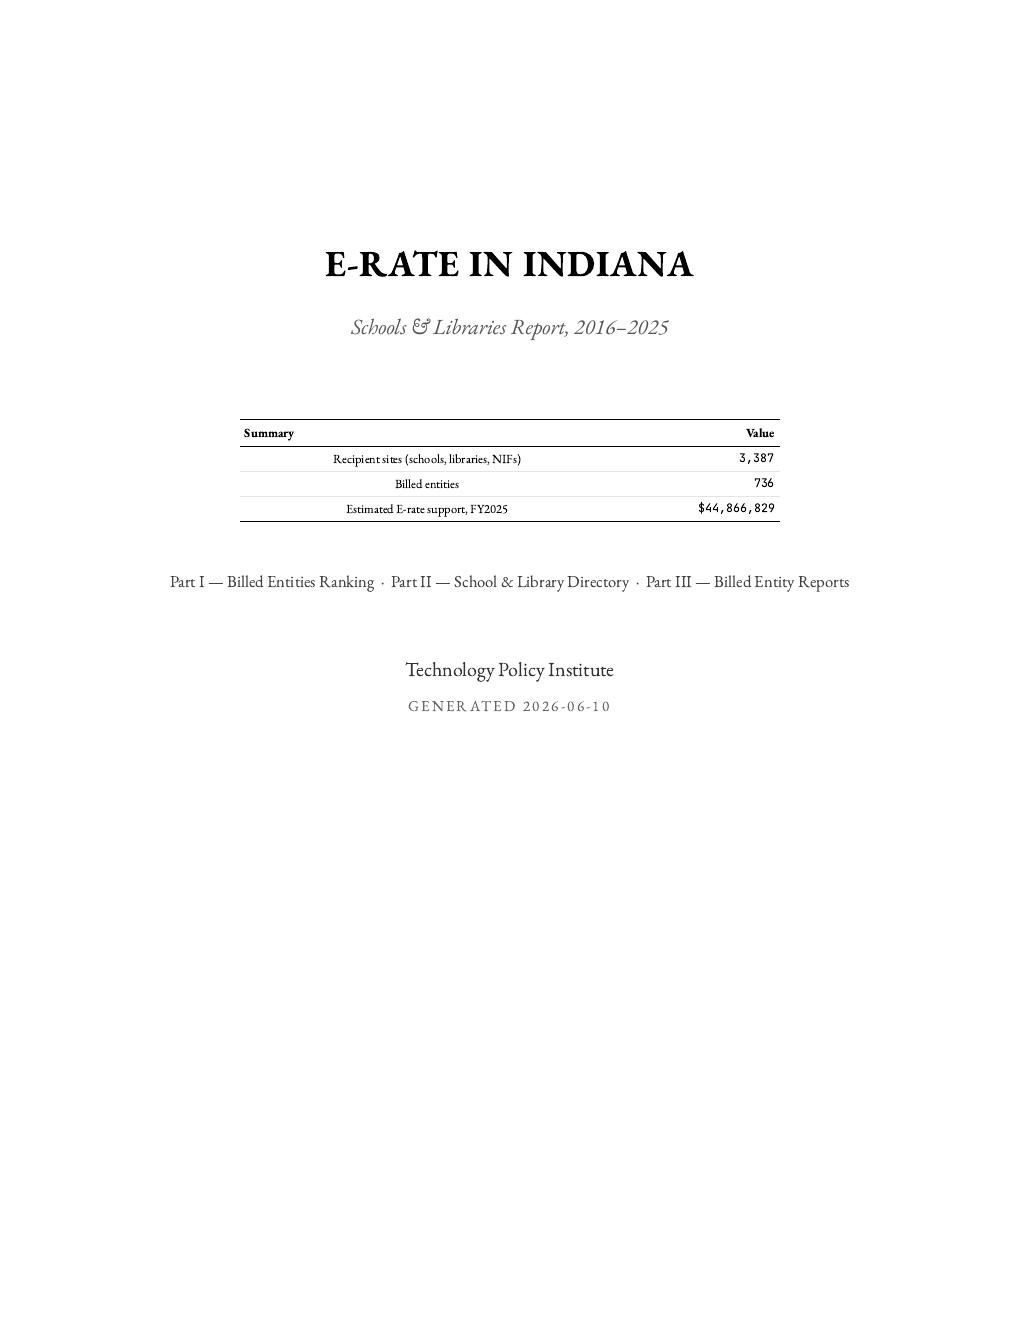
Indiana report cover
Indiana
1,785 pages · 3,387 recipient sites
↓ Download PDFBrowse online →
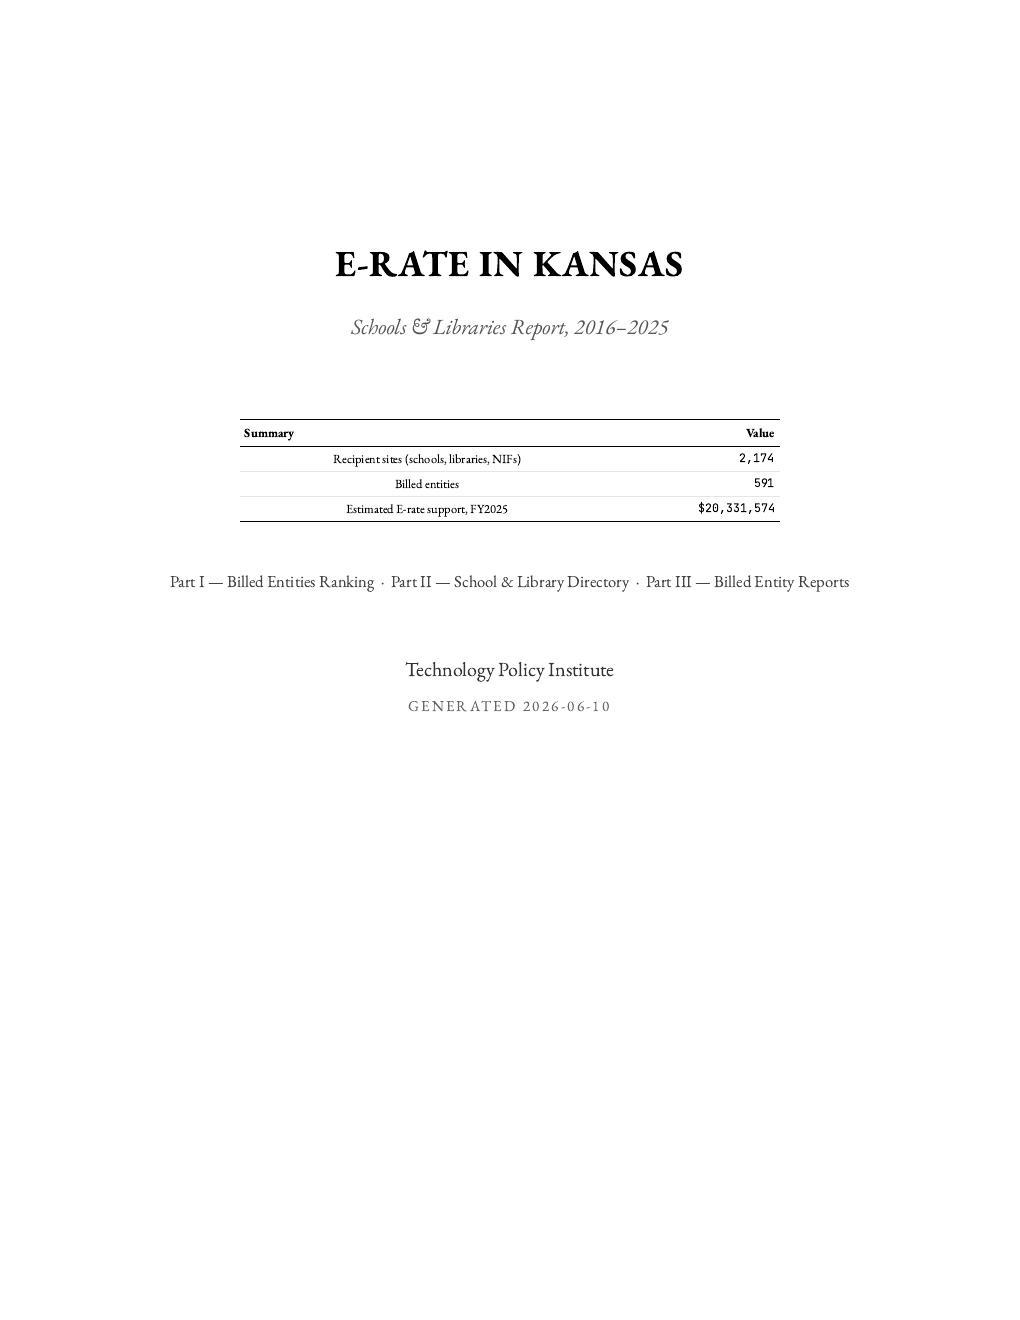
Kansas report cover
Kansas
1,518 pages · 2,174 recipient sites
↓ Download PDFBrowse online →
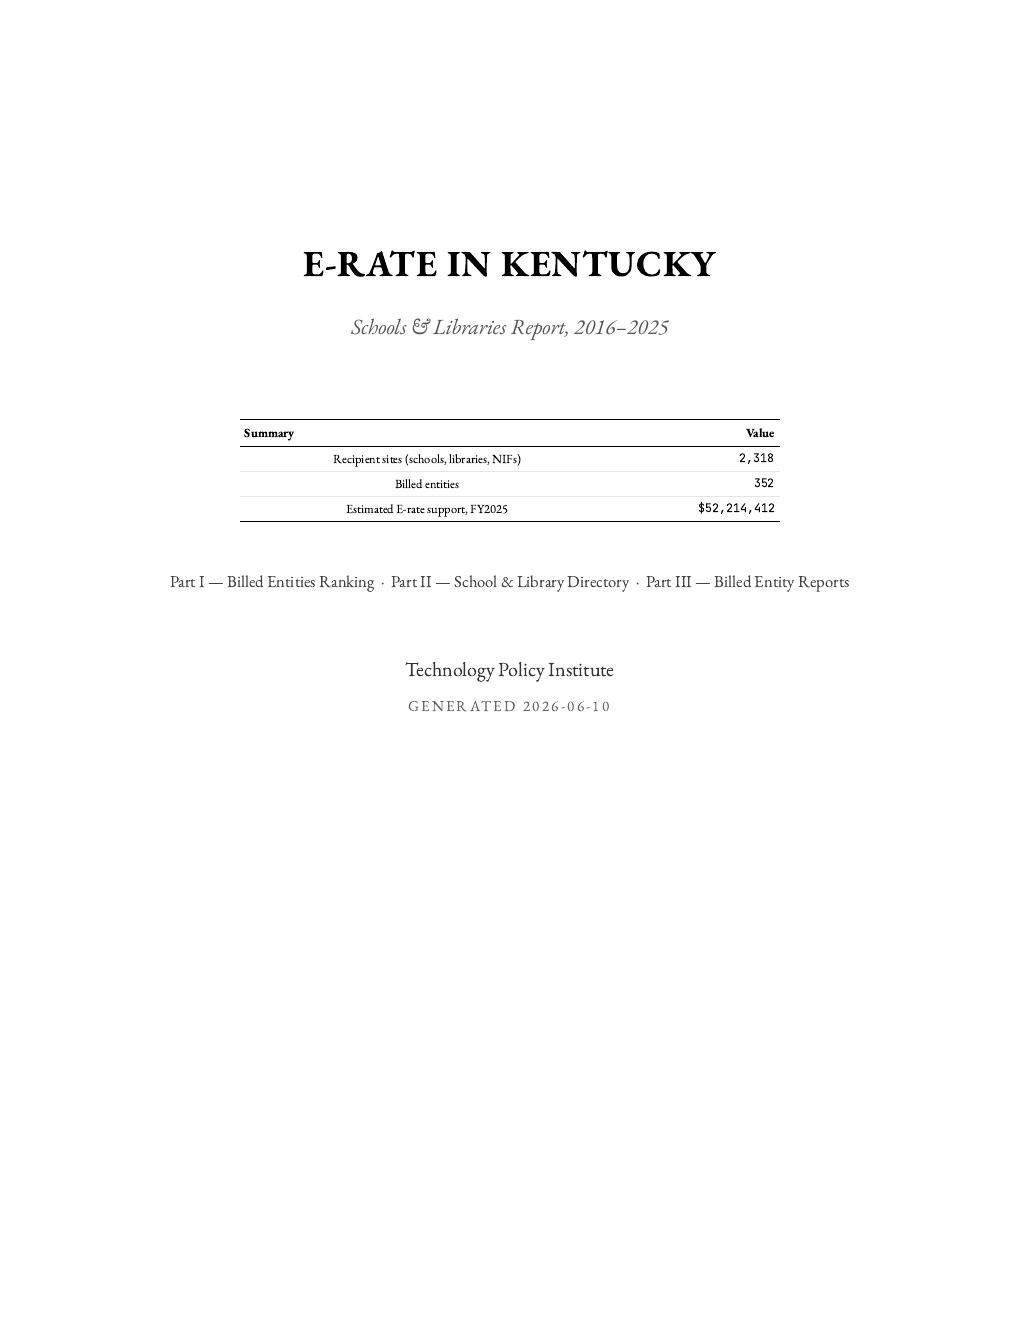
Kentucky report cover
Kentucky
979 pages · 2,318 recipient sites
↓ Download PDFBrowse online →
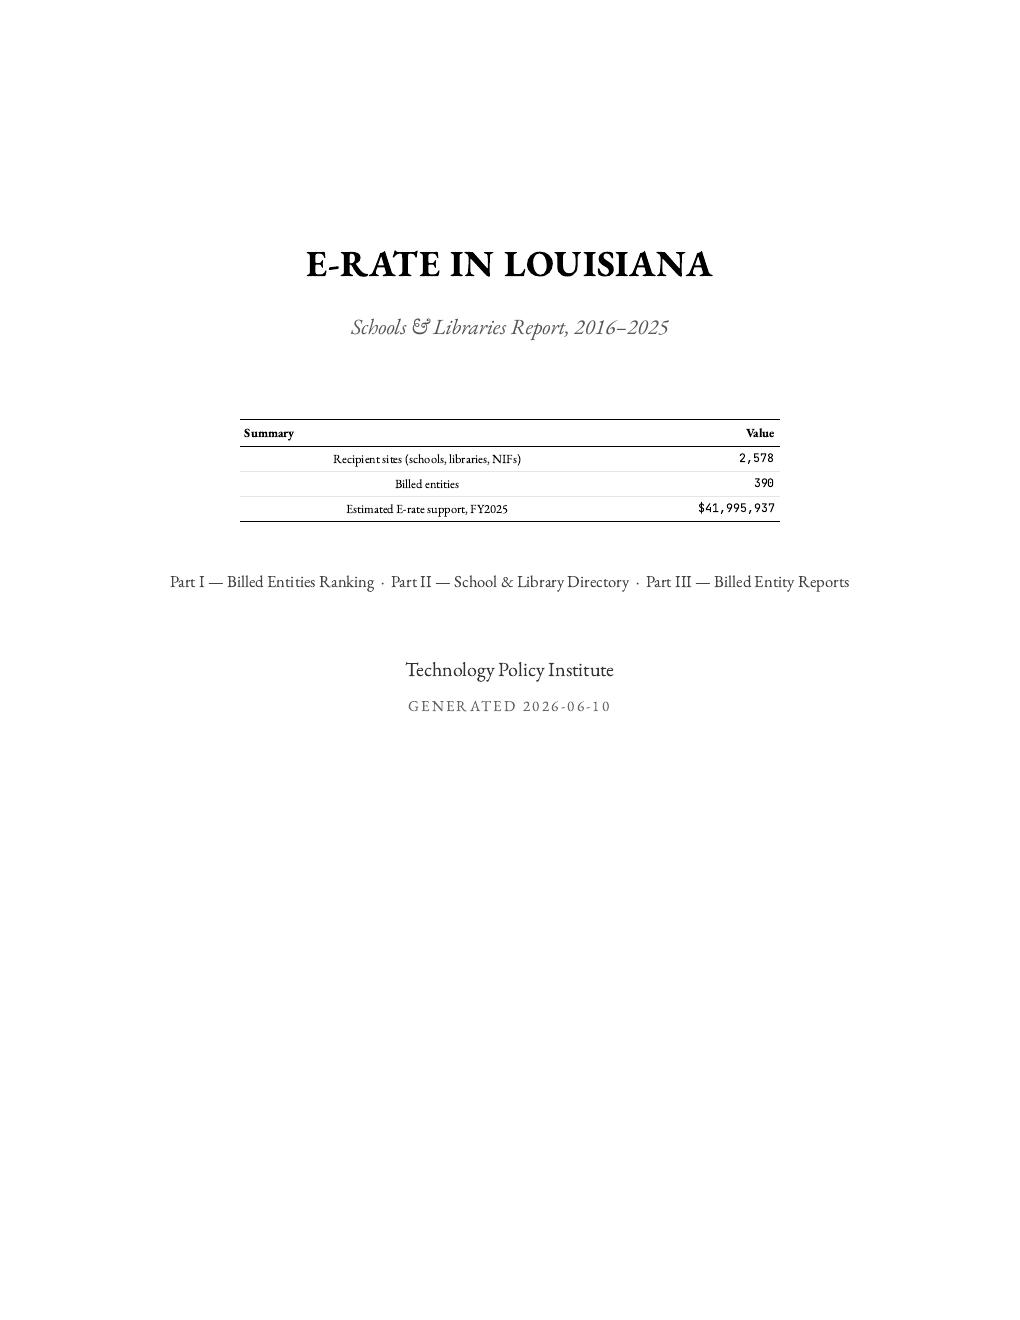
Louisiana report cover
Louisiana
931 pages · 2,578 recipient sites
↓ Download PDFBrowse online →
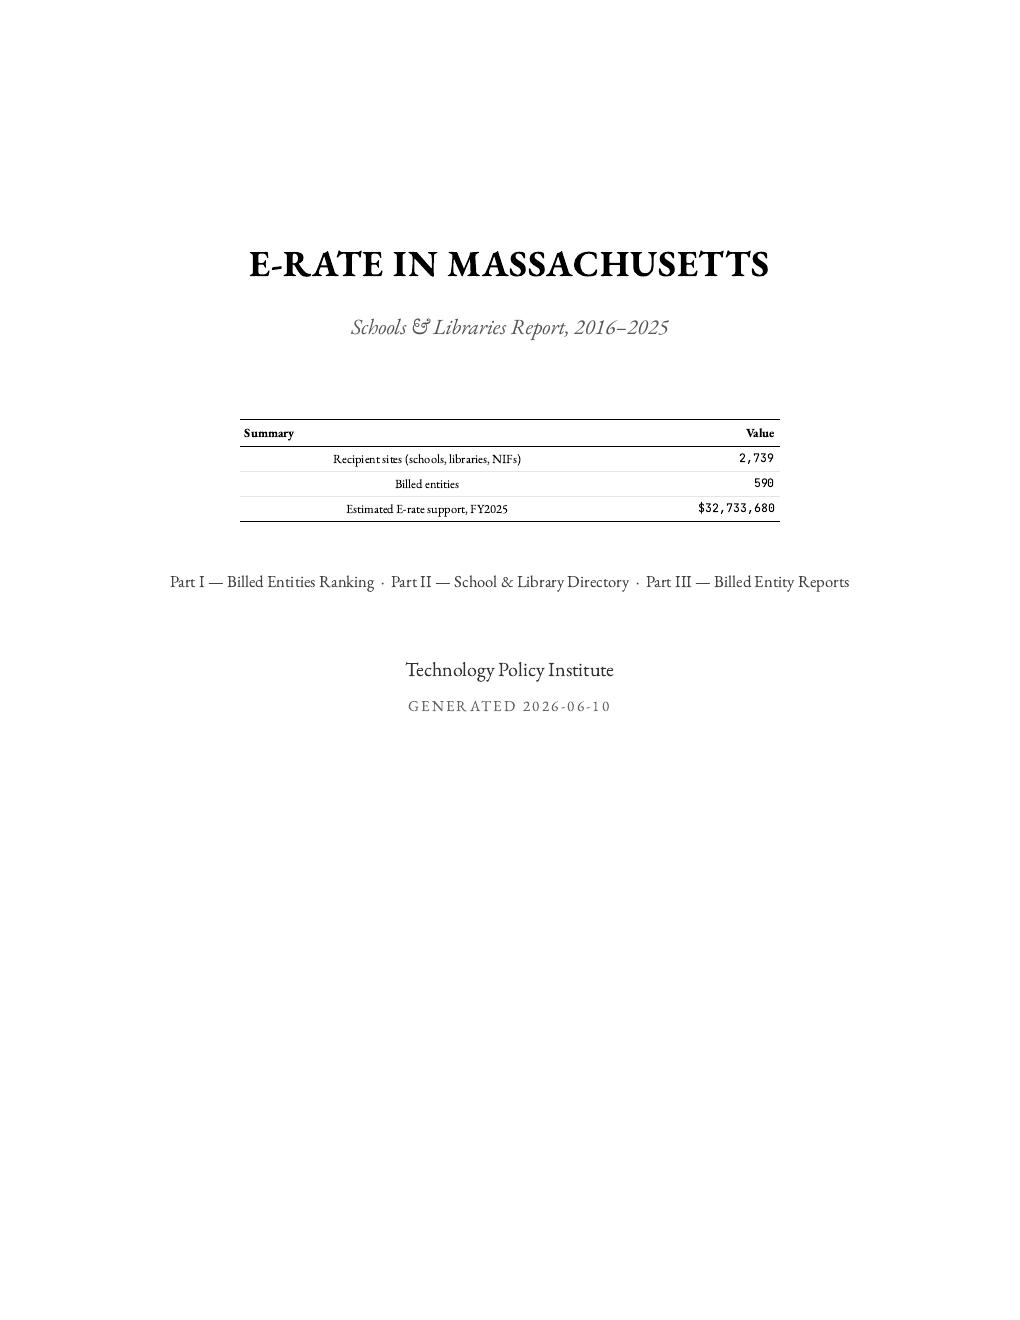
Massachusetts report cover
Massachusetts
1,446 pages · 2,739 recipient sites
↓ Download PDFBrowse online →
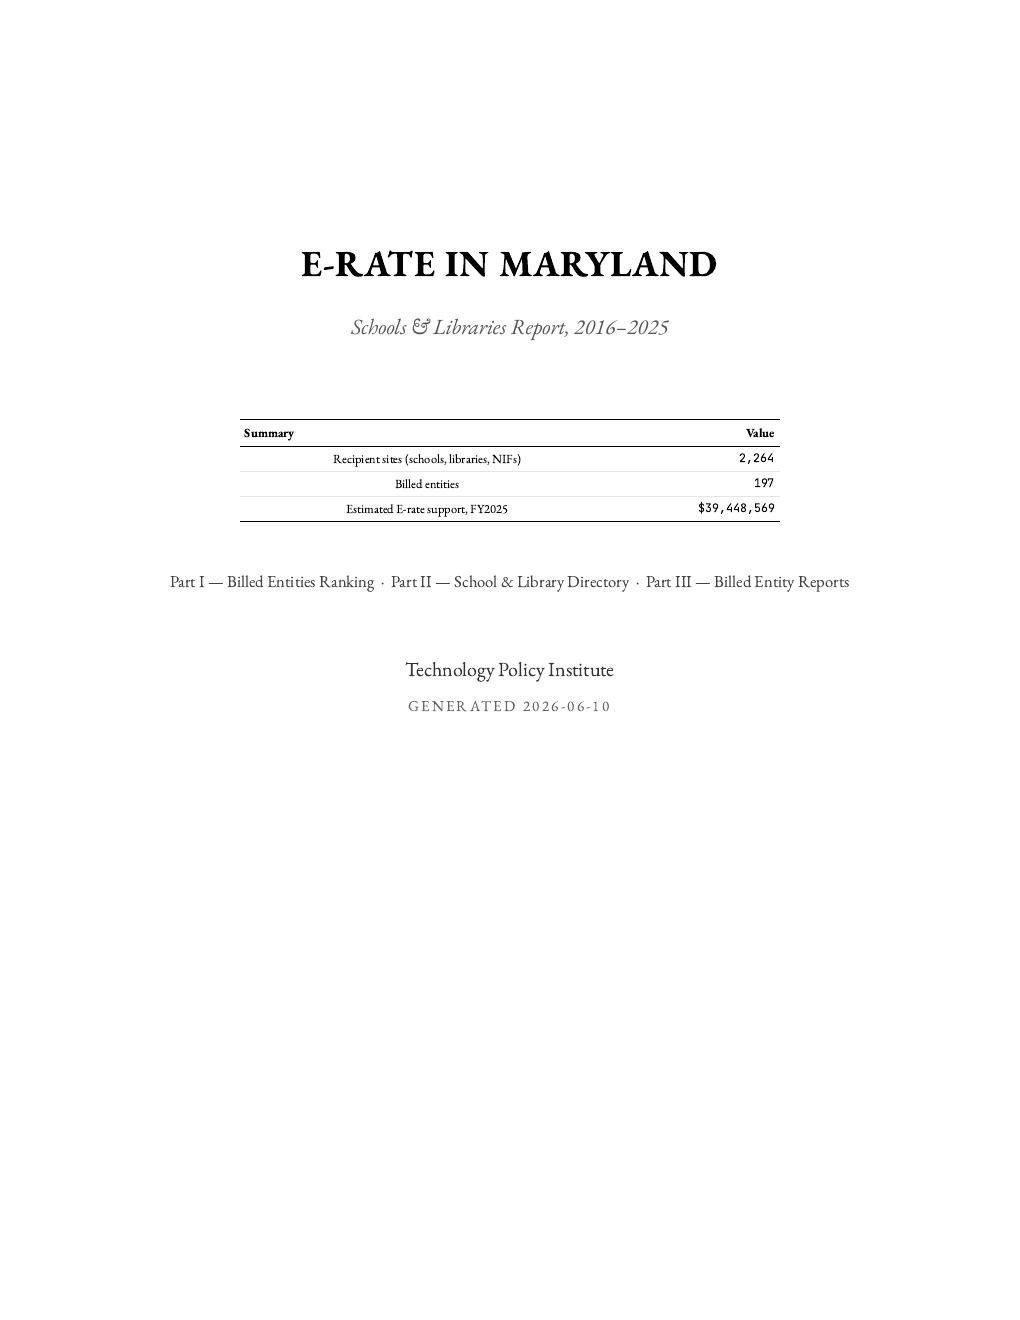
Maryland report cover
Maryland
546 pages · 2,264 recipient sites
↓ Download PDFBrowse online →
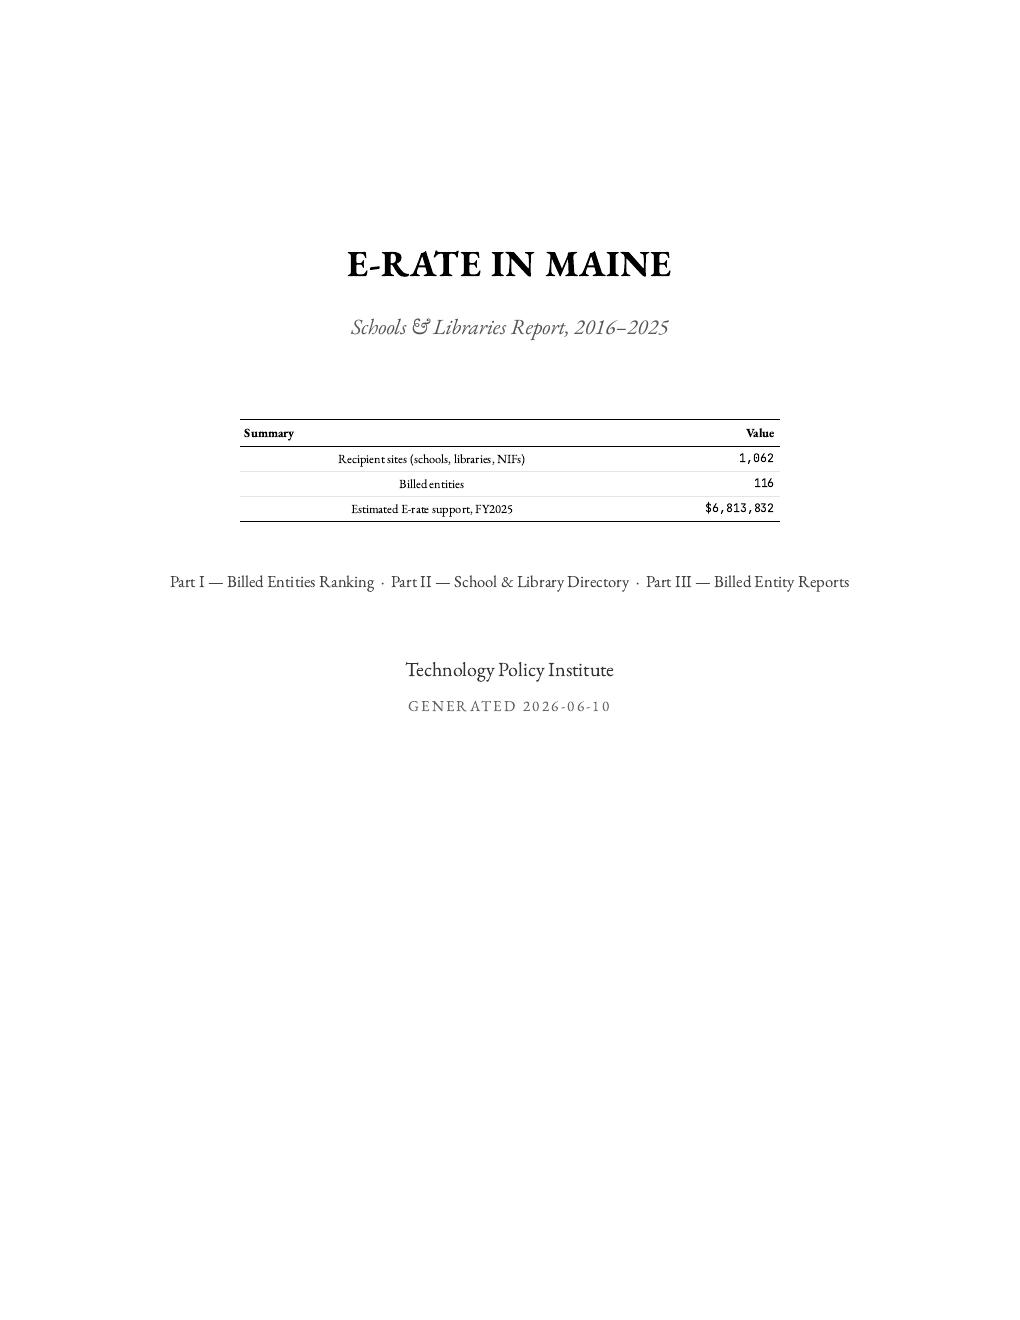
Maine report cover
Maine
336 pages · 1,062 recipient sites
↓ Download PDFBrowse online →
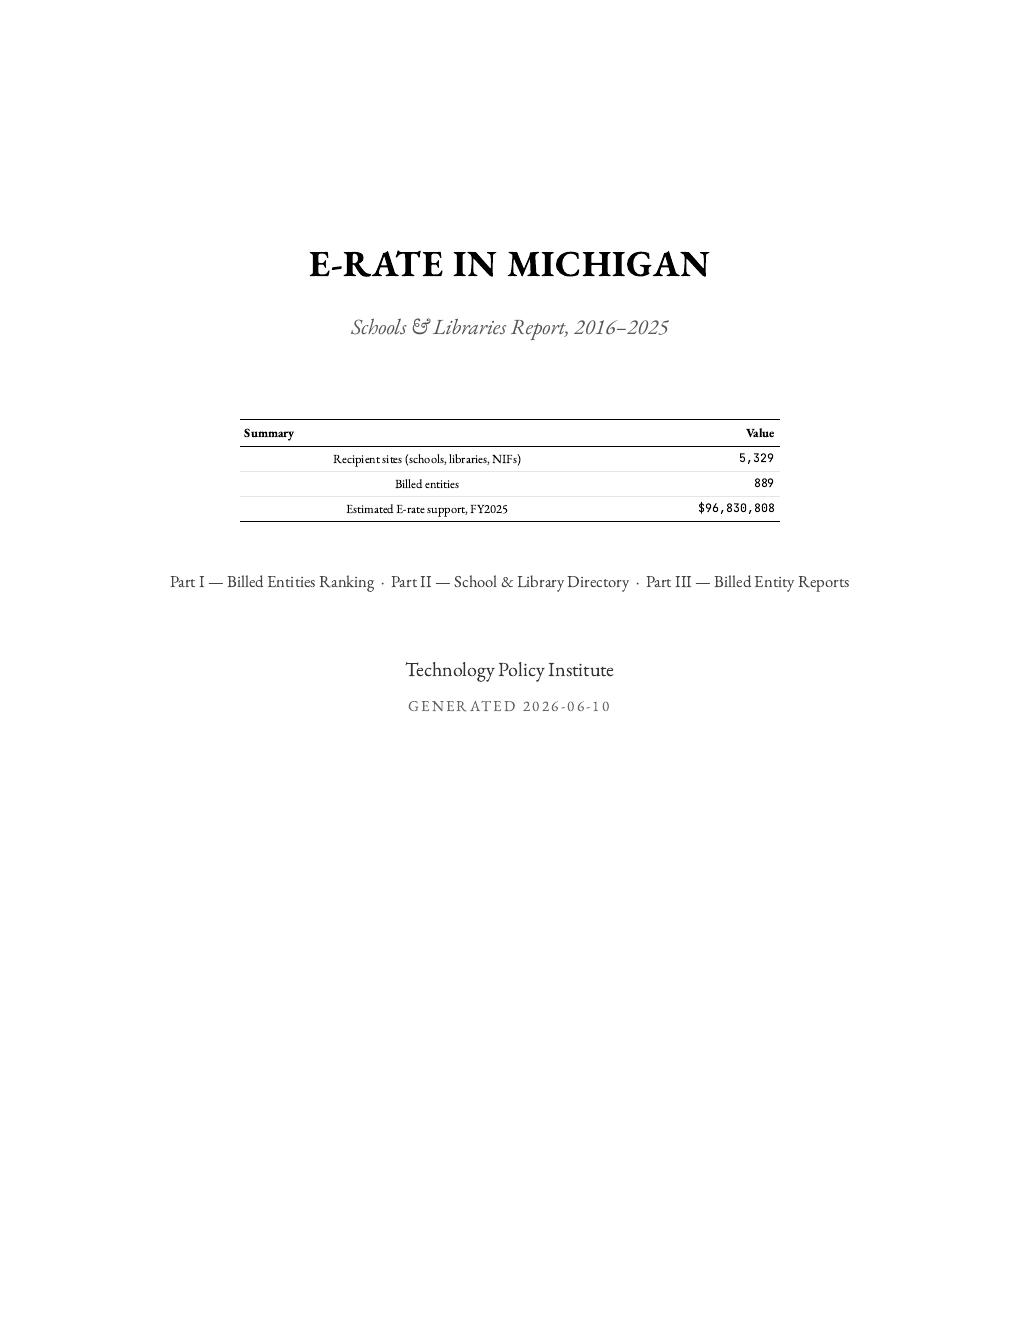
Michigan report cover
Michigan
2,173 pages · 5,329 recipient sites
↓ Download PDFBrowse online →
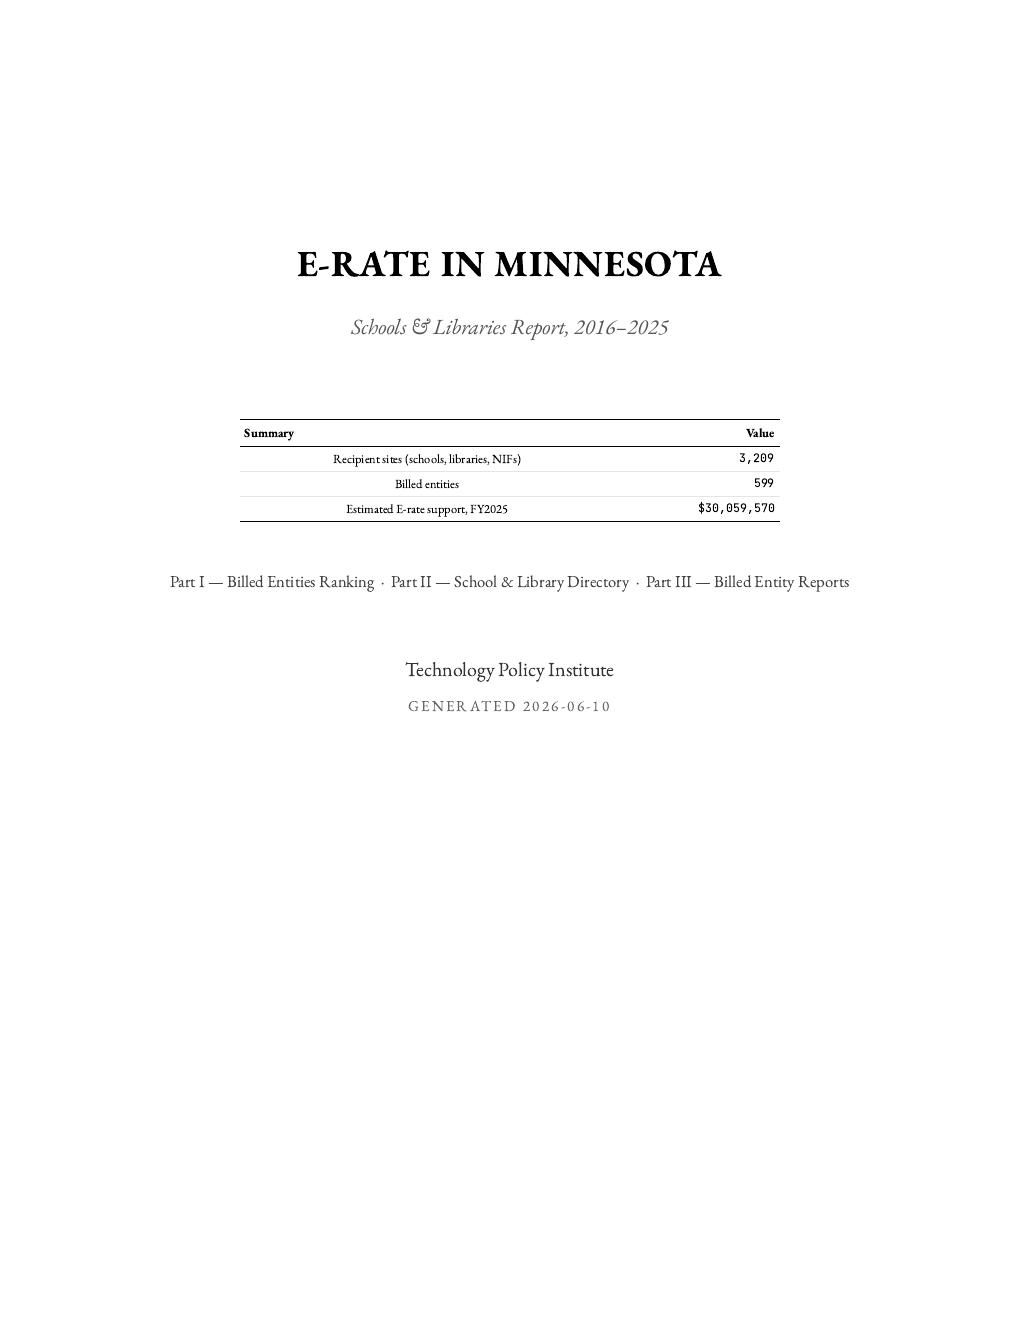
Minnesota report cover
Minnesota
1,437 pages · 3,209 recipient sites
↓ Download PDFBrowse online →
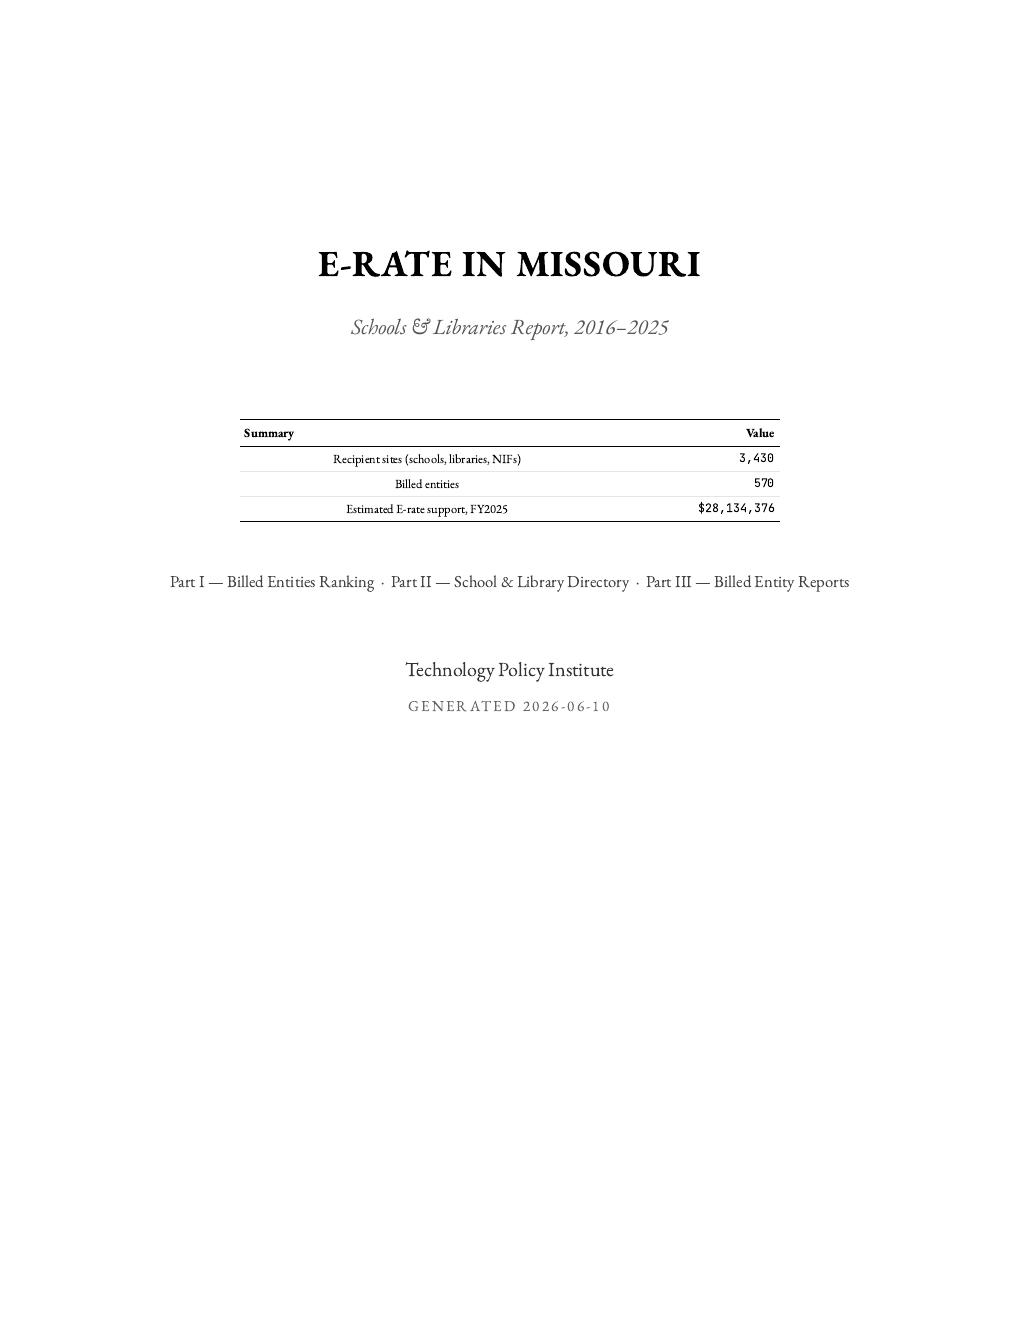
Missouri report cover
Missouri
1,532 pages · 3,430 recipient sites
↓ Download PDFBrowse online →
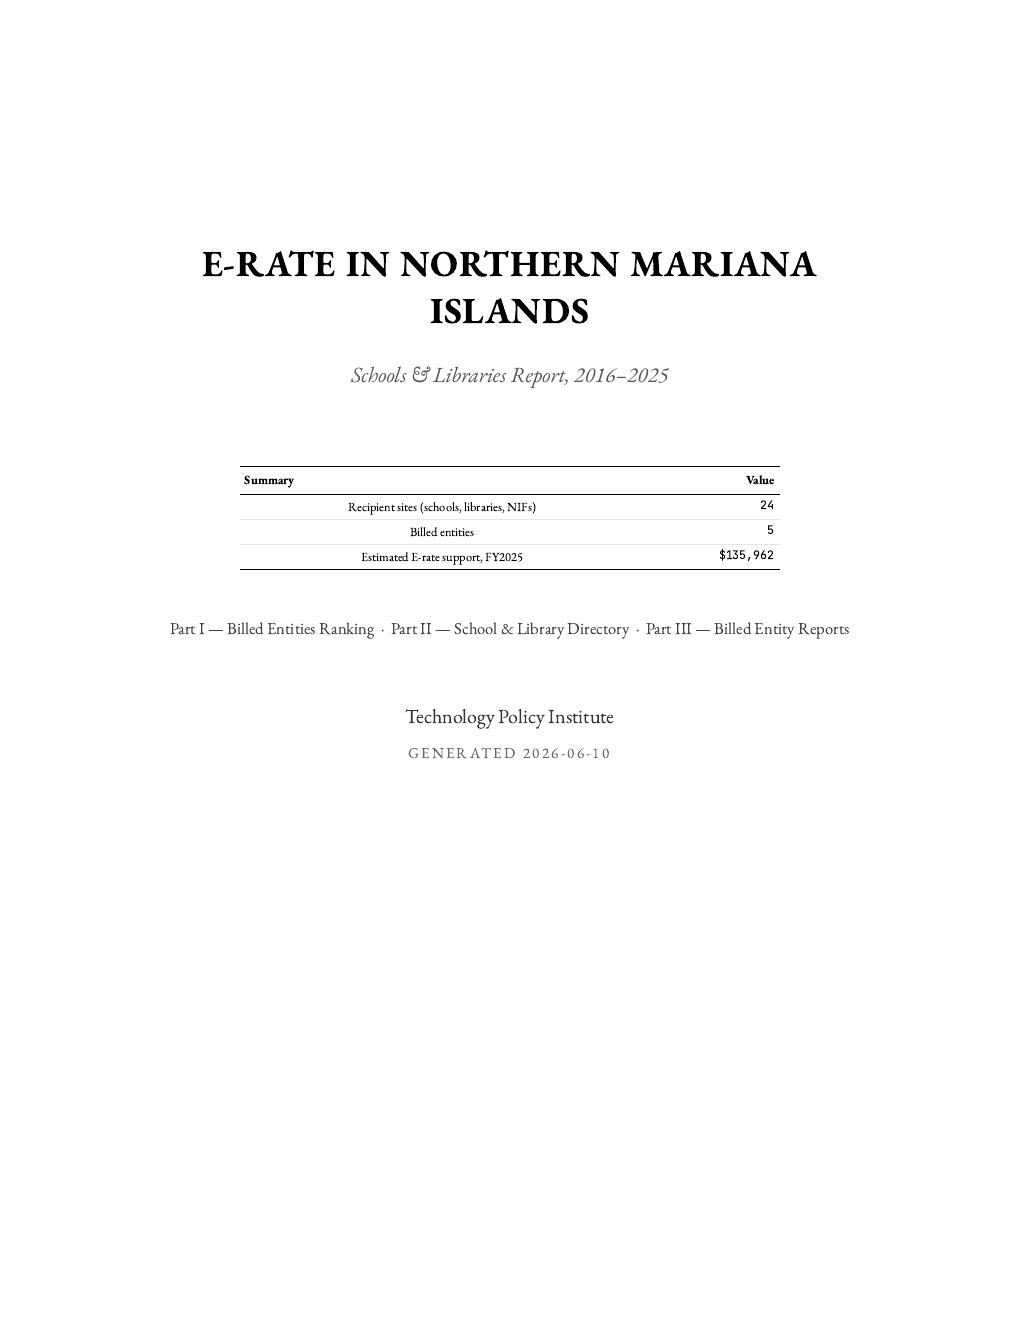
Northern Mariana Islands report cover
Northern Mariana Islands
13 pages · 24 recipient sites
↓ Download PDFBrowse online →
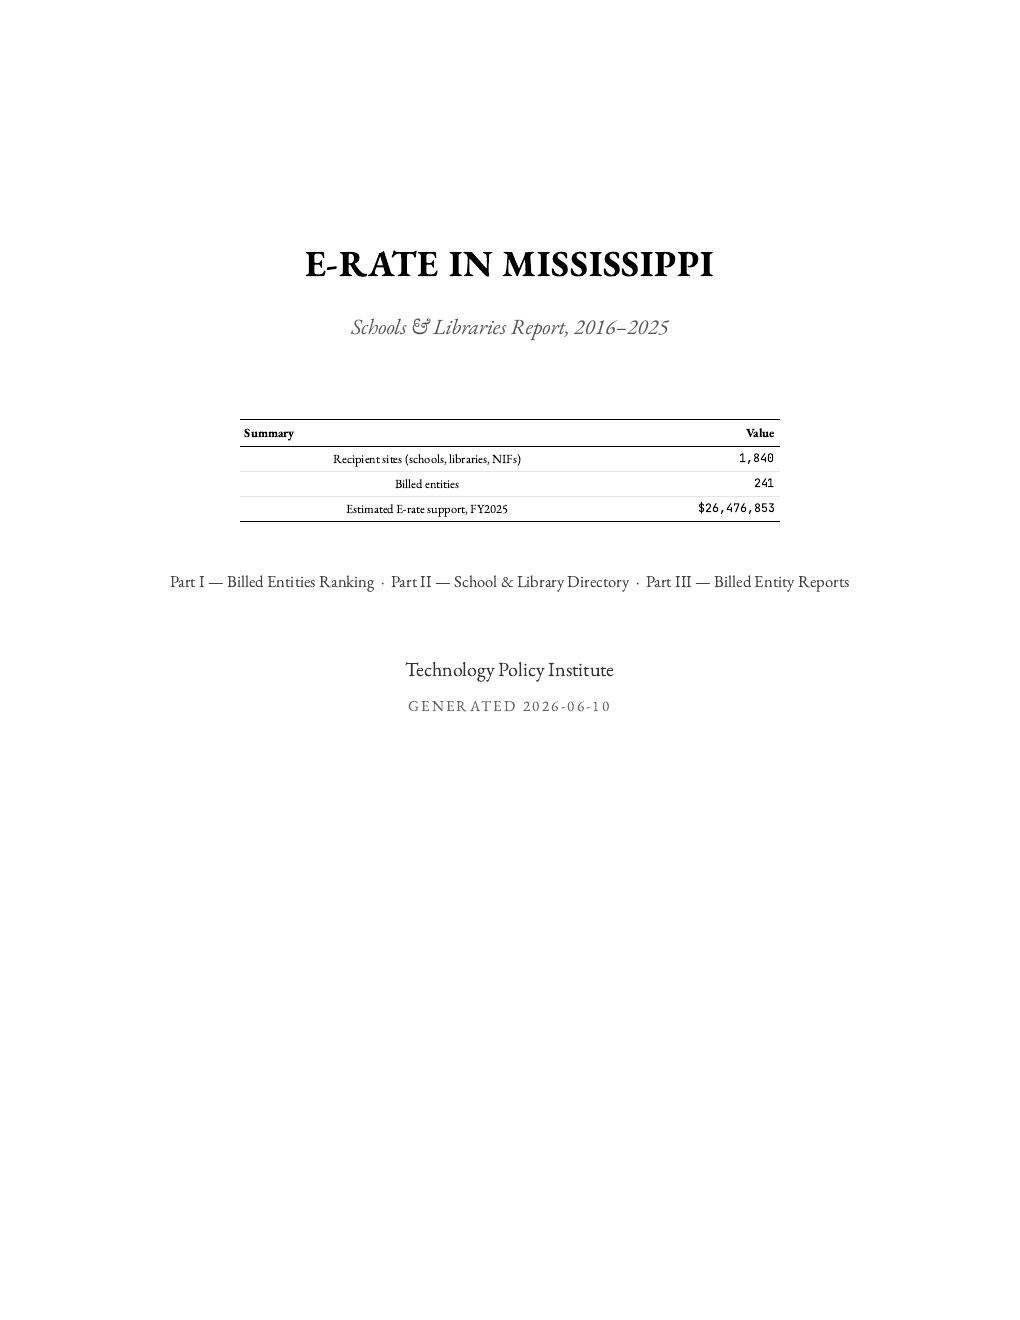
Mississippi report cover
Mississippi
707 pages · 1,840 recipient sites
↓ Download PDFBrowse online →
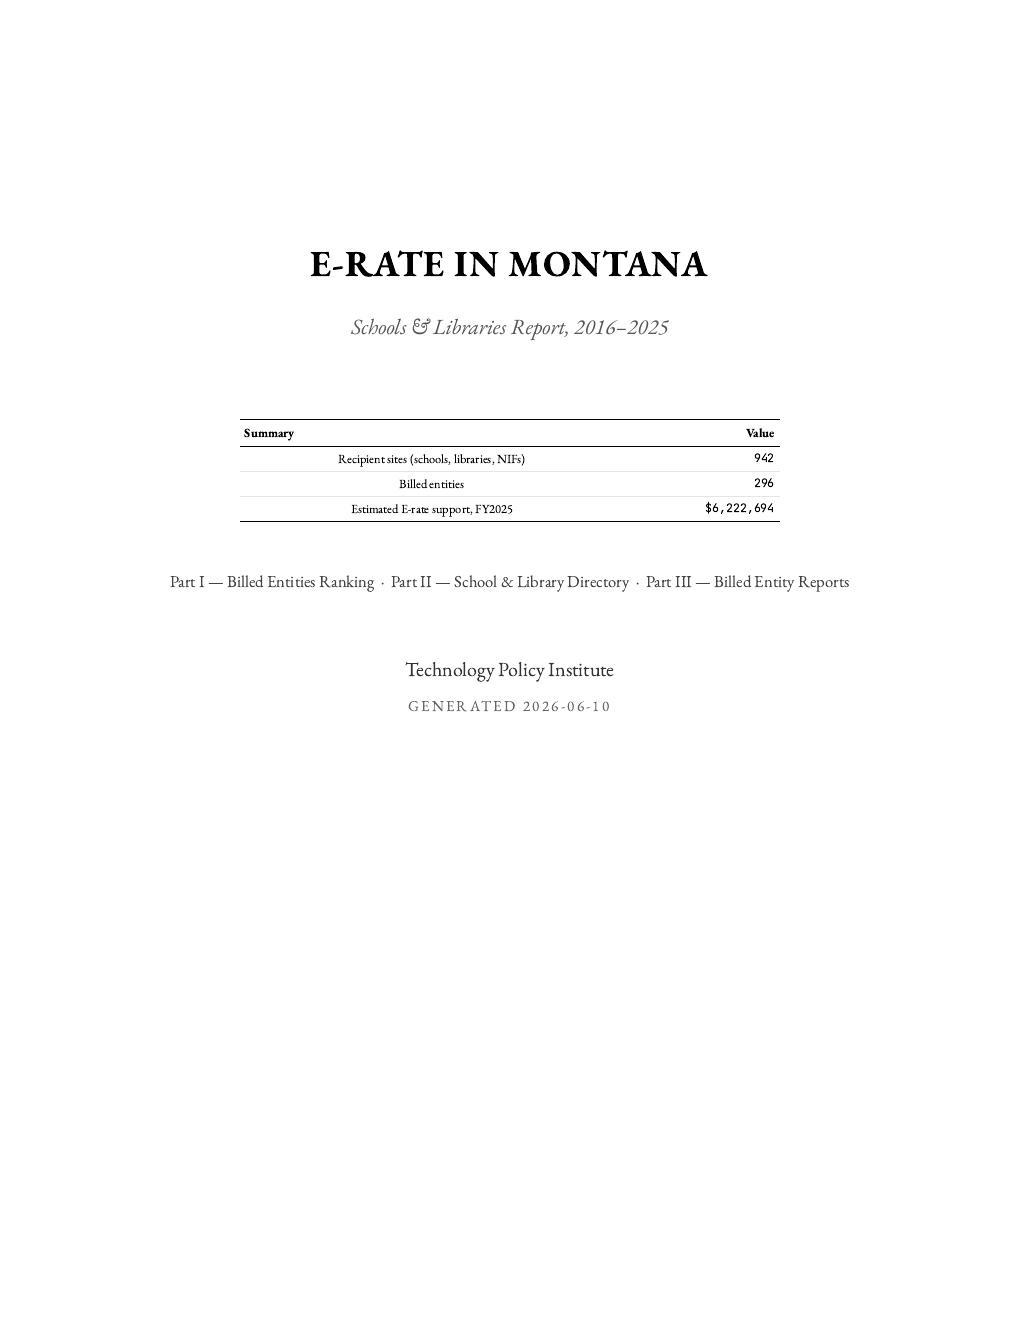
Montana report cover
Montana
765 pages · 942 recipient sites
↓ Download PDFBrowse online →
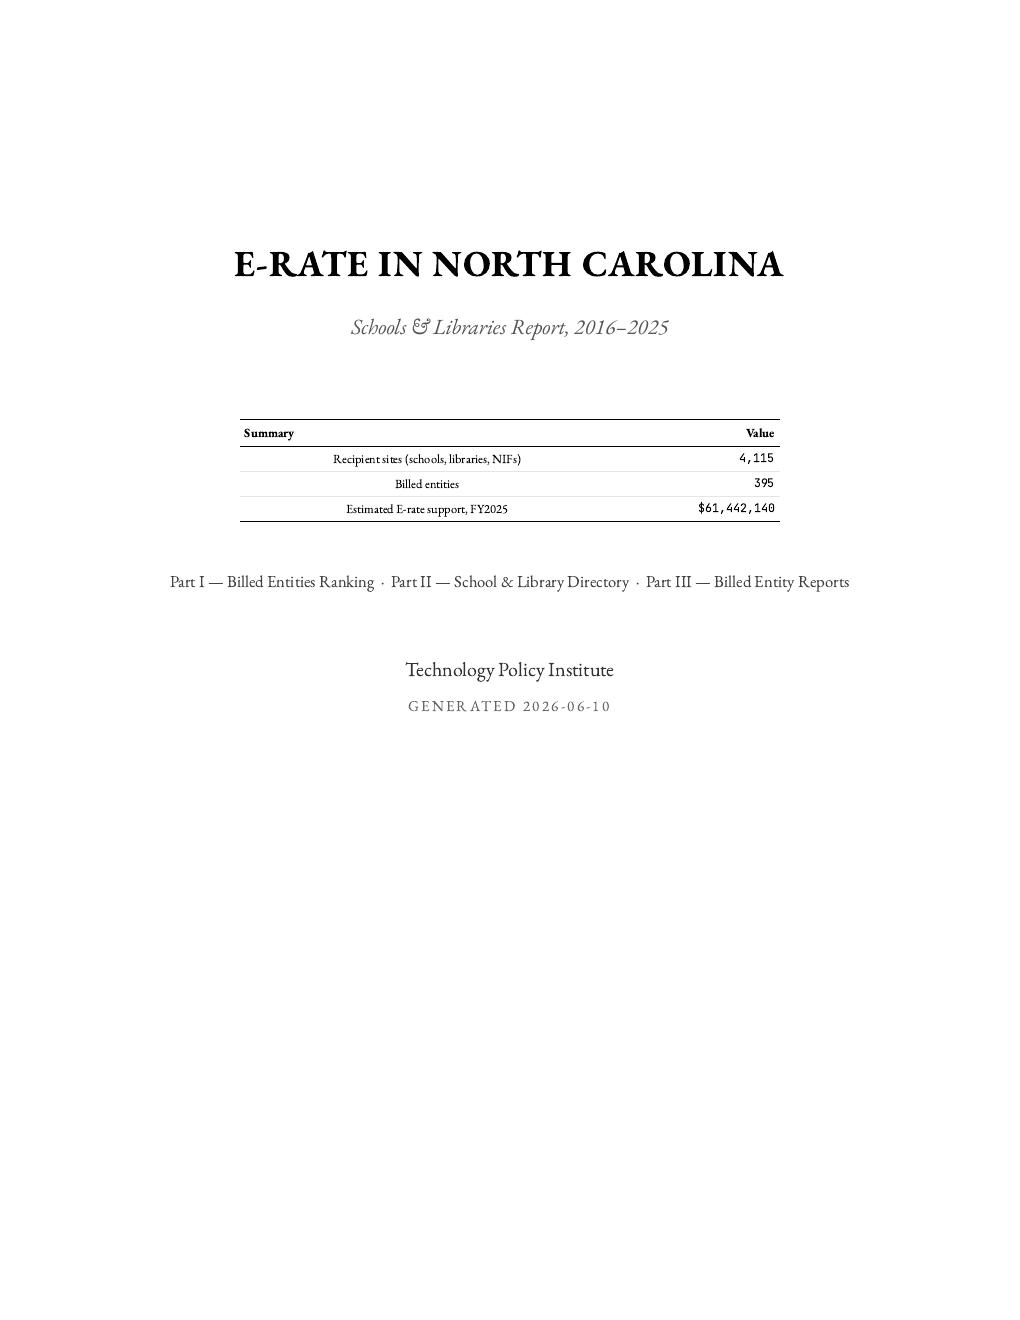
North Carolina report cover
North Carolina
1,025 pages · 4,115 recipient sites
↓ Download PDFBrowse online →
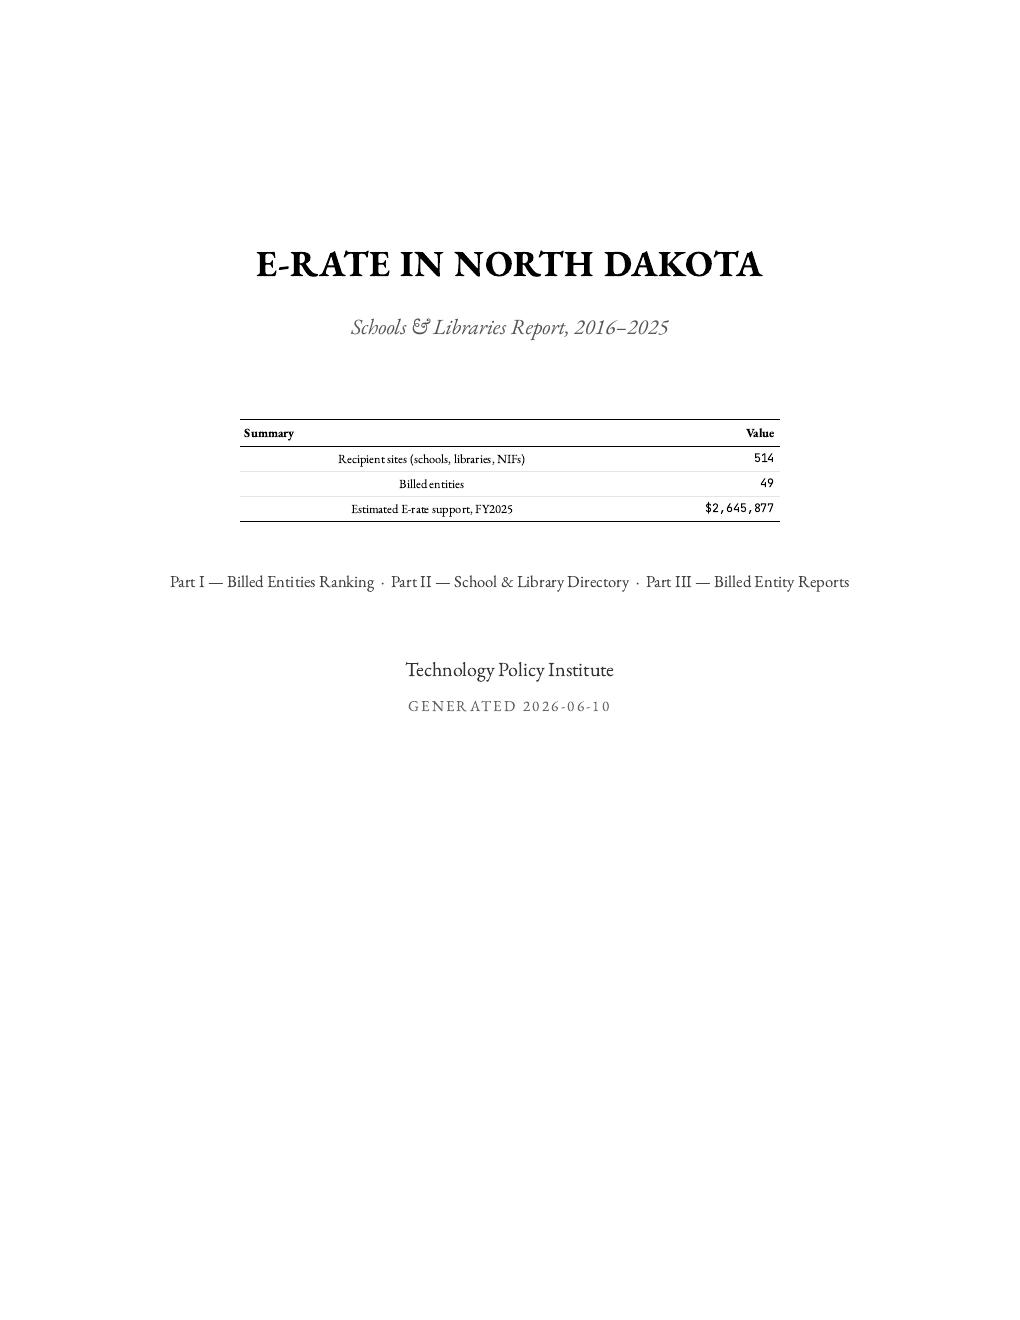
North Dakota report cover
North Dakota
133 pages · 514 recipient sites
↓ Download PDFBrowse online →
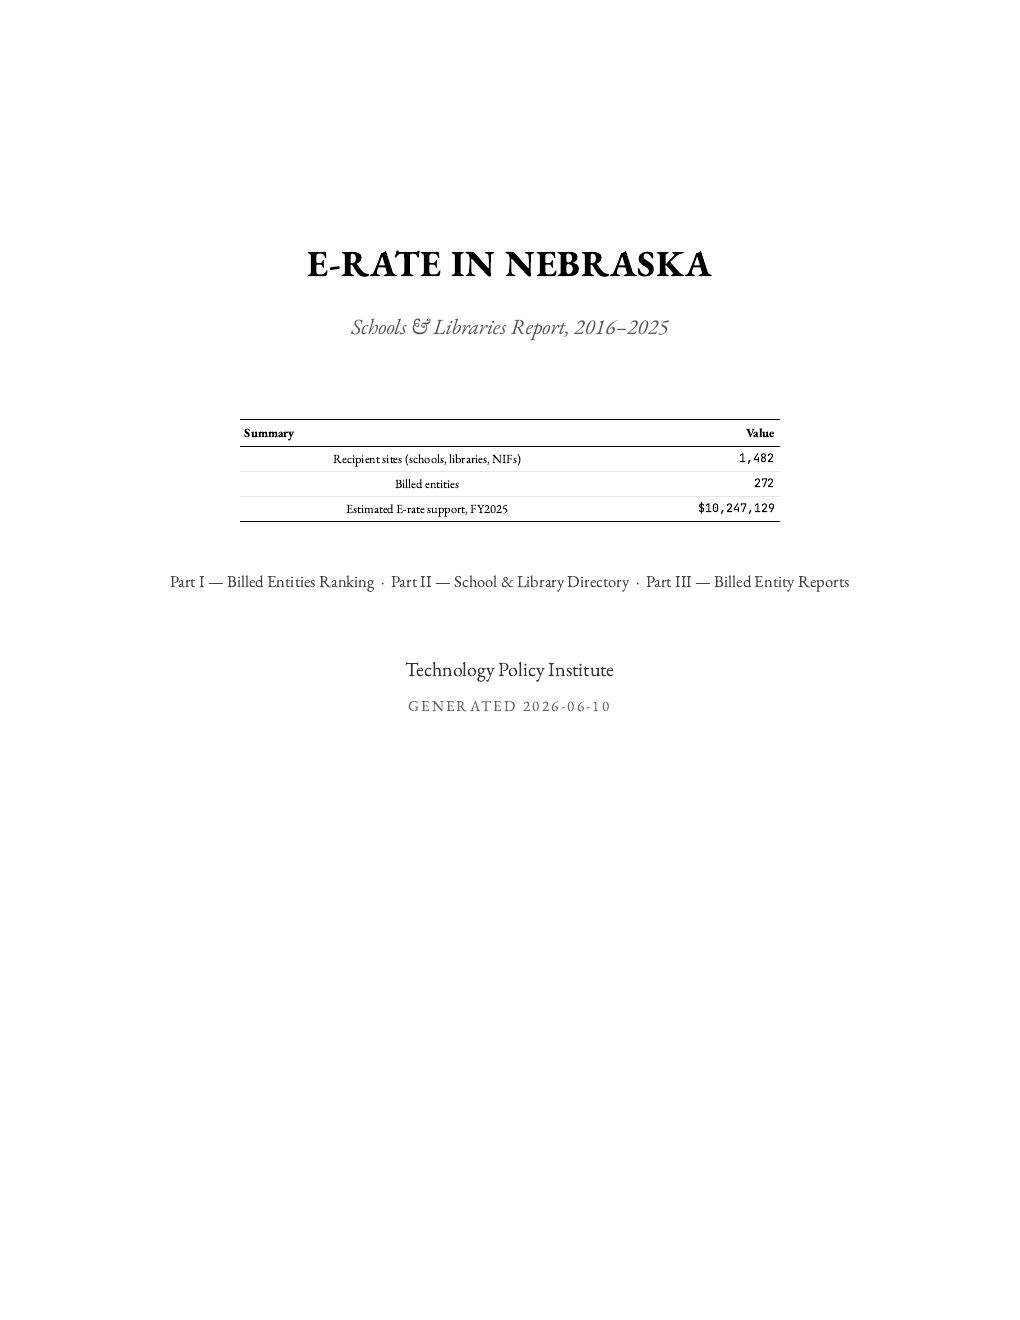
Nebraska report cover
Nebraska
619 pages · 1,482 recipient sites
↓ Download PDFBrowse online →
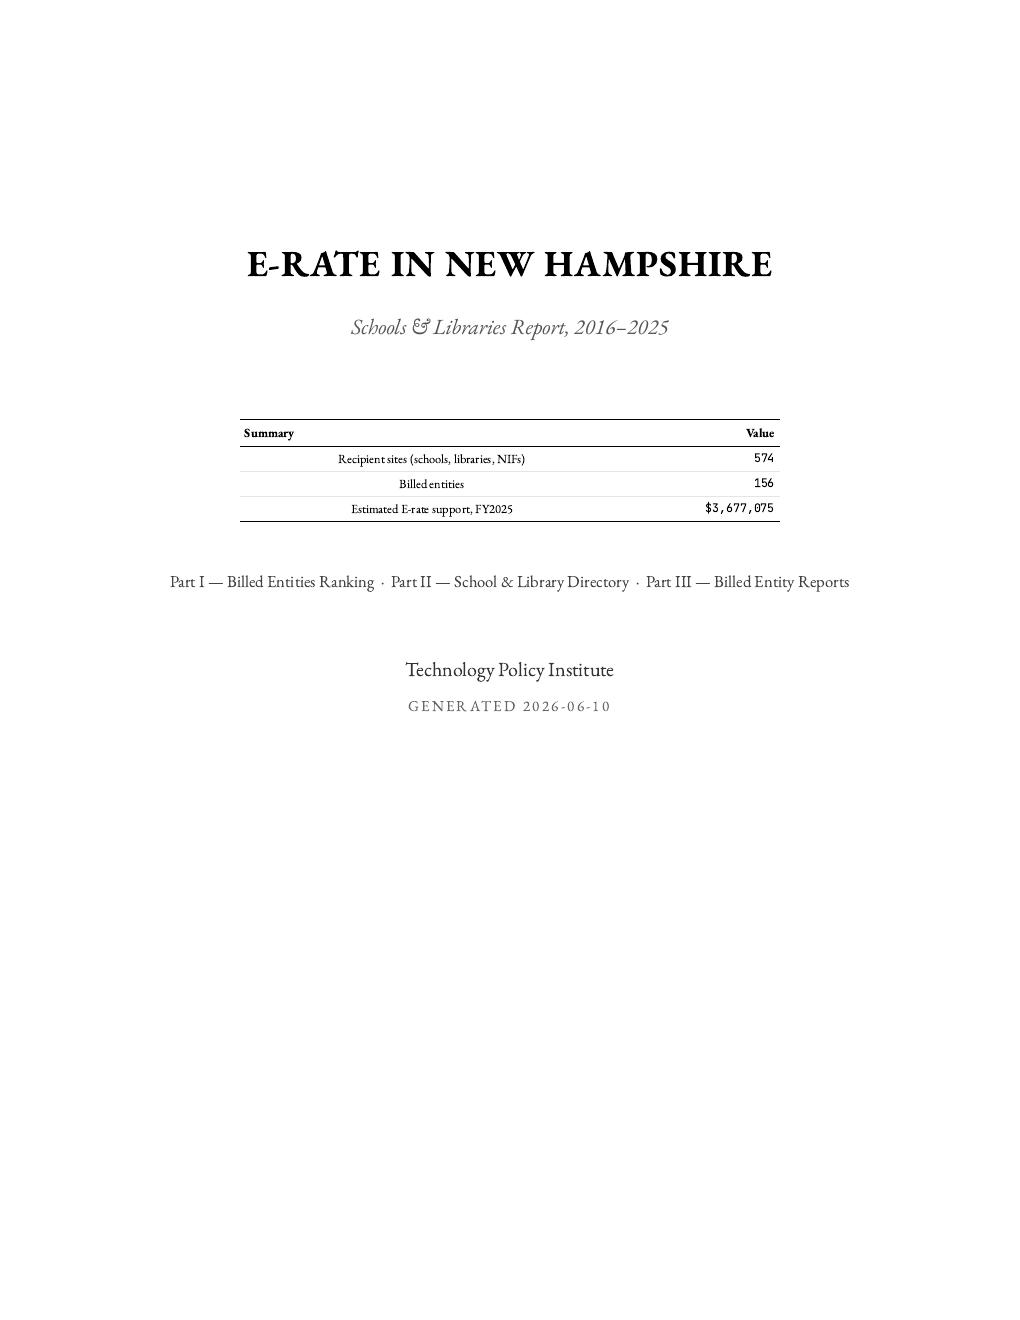
New Hampshire report cover
New Hampshire
372 pages · 574 recipient sites
↓ Download PDFBrowse online →
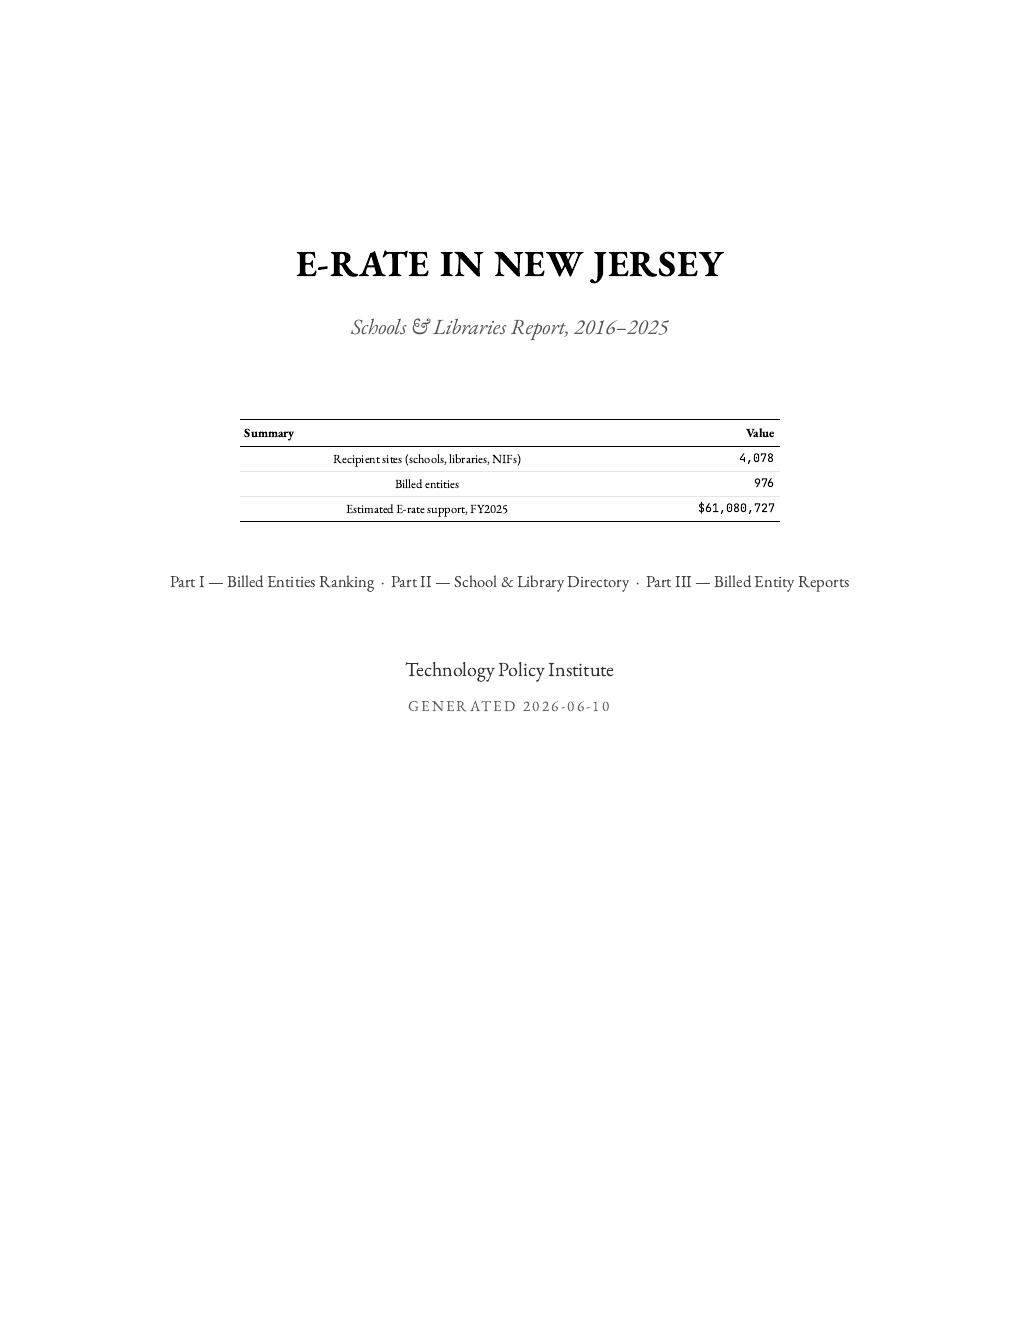
New Jersey report cover
New Jersey
2,471 pages · 4,078 recipient sites
↓ Download PDFBrowse online →
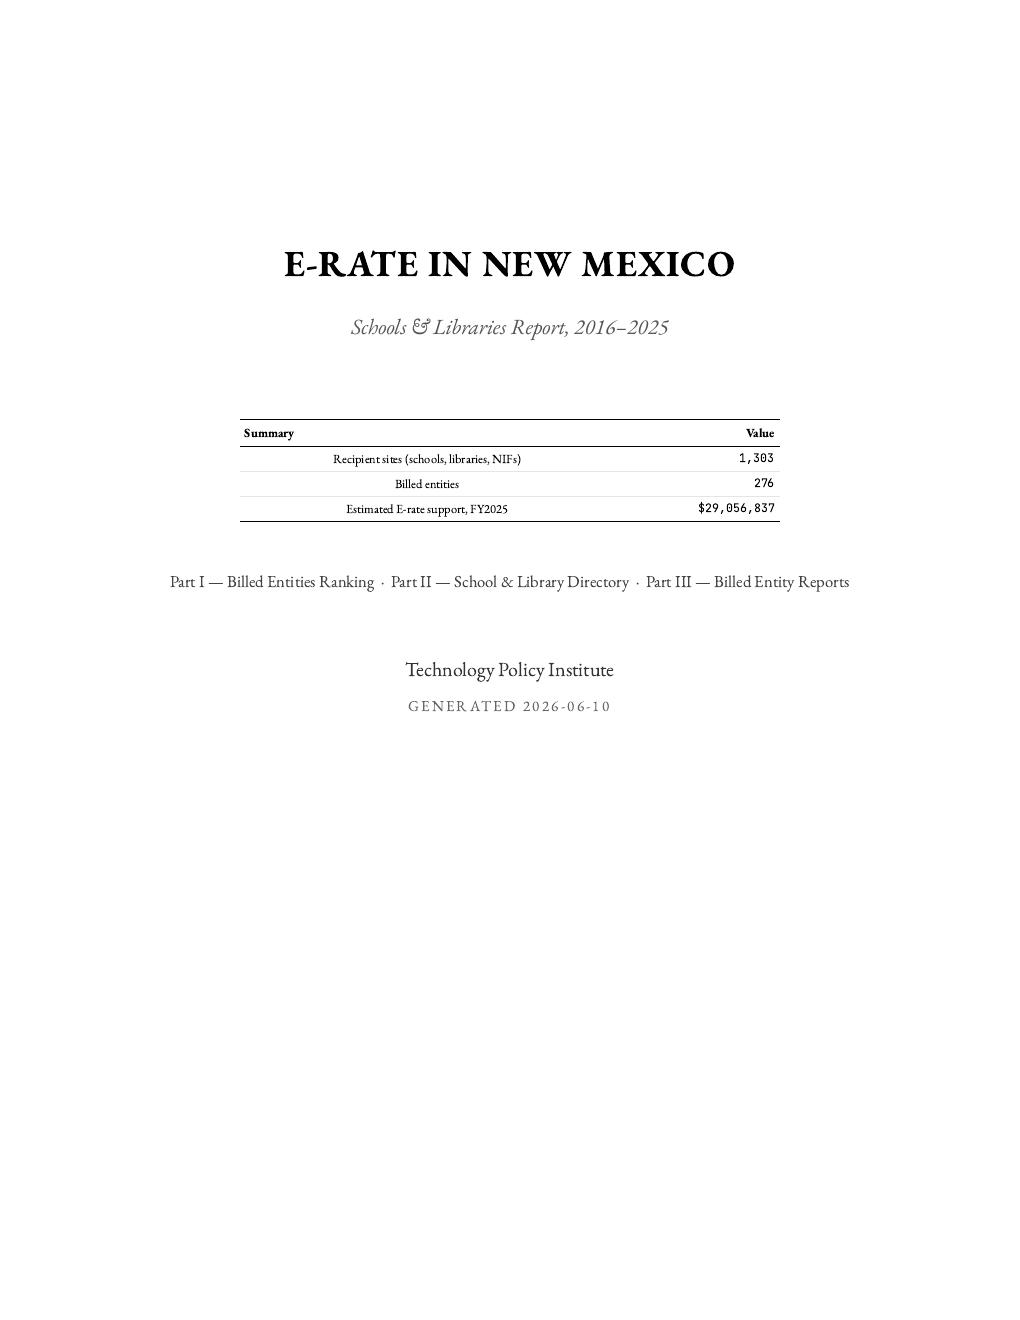
New Mexico report cover
New Mexico
597 pages · 1,303 recipient sites
↓ Download PDFBrowse online →
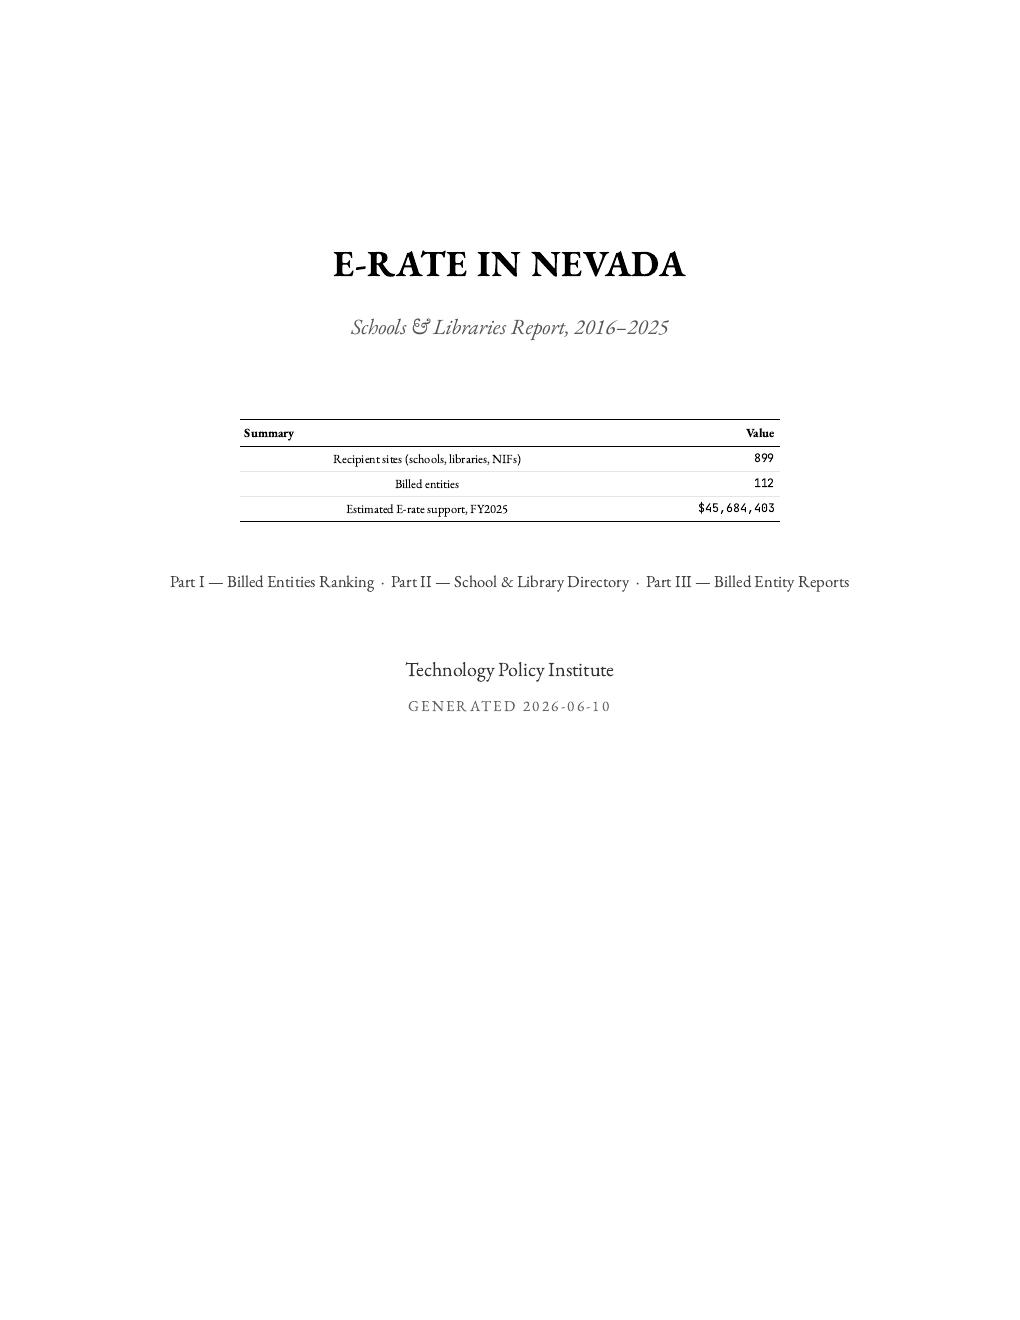
Nevada report cover
Nevada
242 pages · 899 recipient sites
↓ Download PDFBrowse online →
New York — New York City & Long Island report cover
New York — New York City & Long Island
2,166 pages · 4,887 recipient sites
↓ Download PDFBrowse online →
New York — Upstate report cover
New York — Upstate
1,385 pages · 4,000 recipient sites
↓ Download PDFBrowse online →
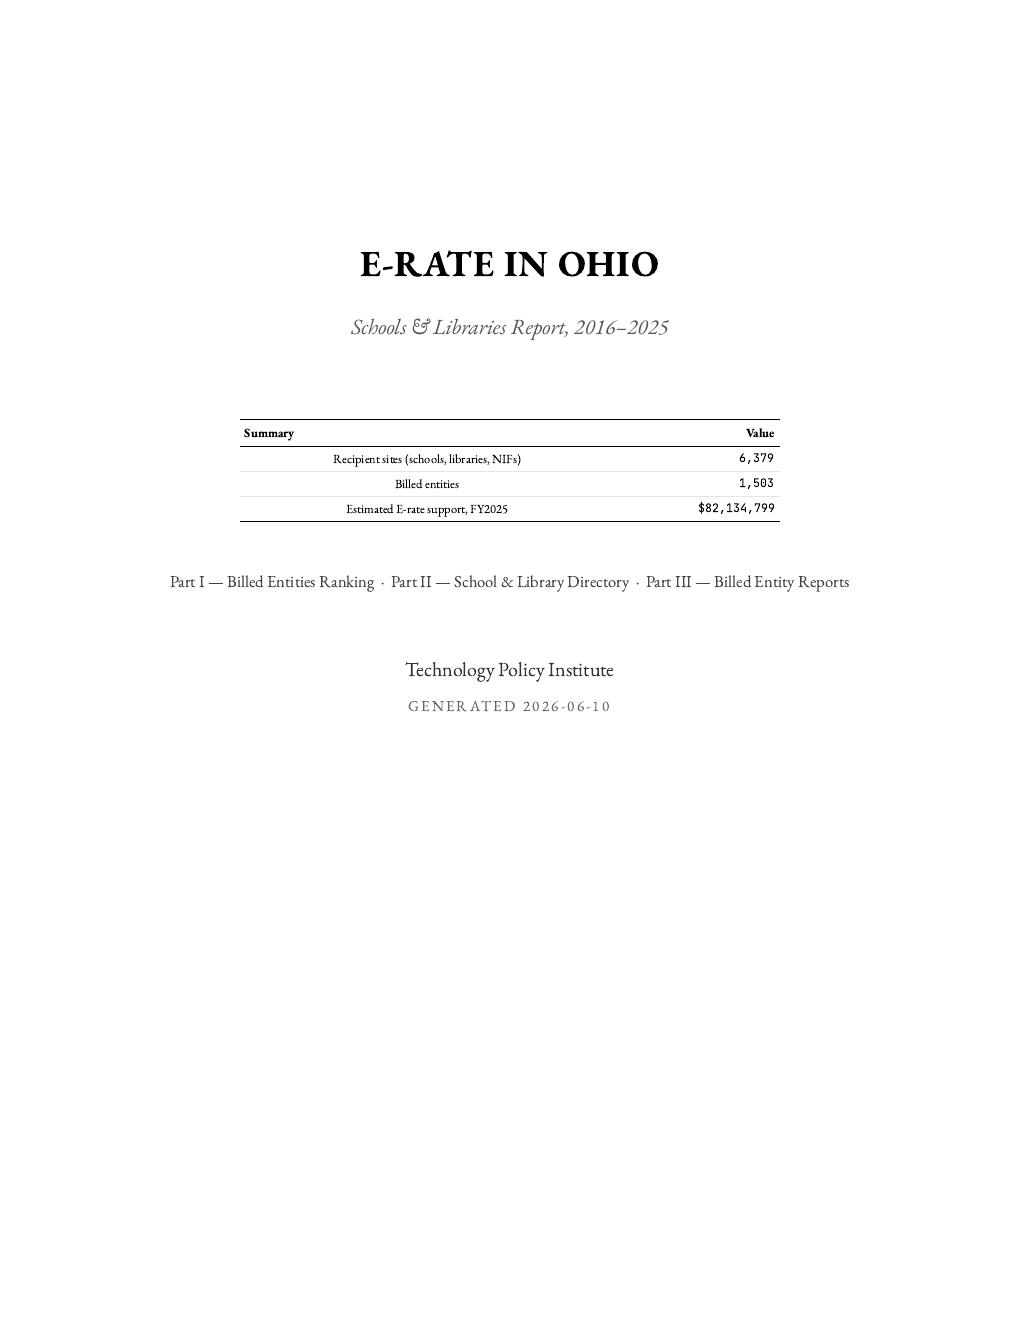
Ohio report cover
Ohio
3,692 pages · 6,379 recipient sites
↓ Download PDFBrowse online →
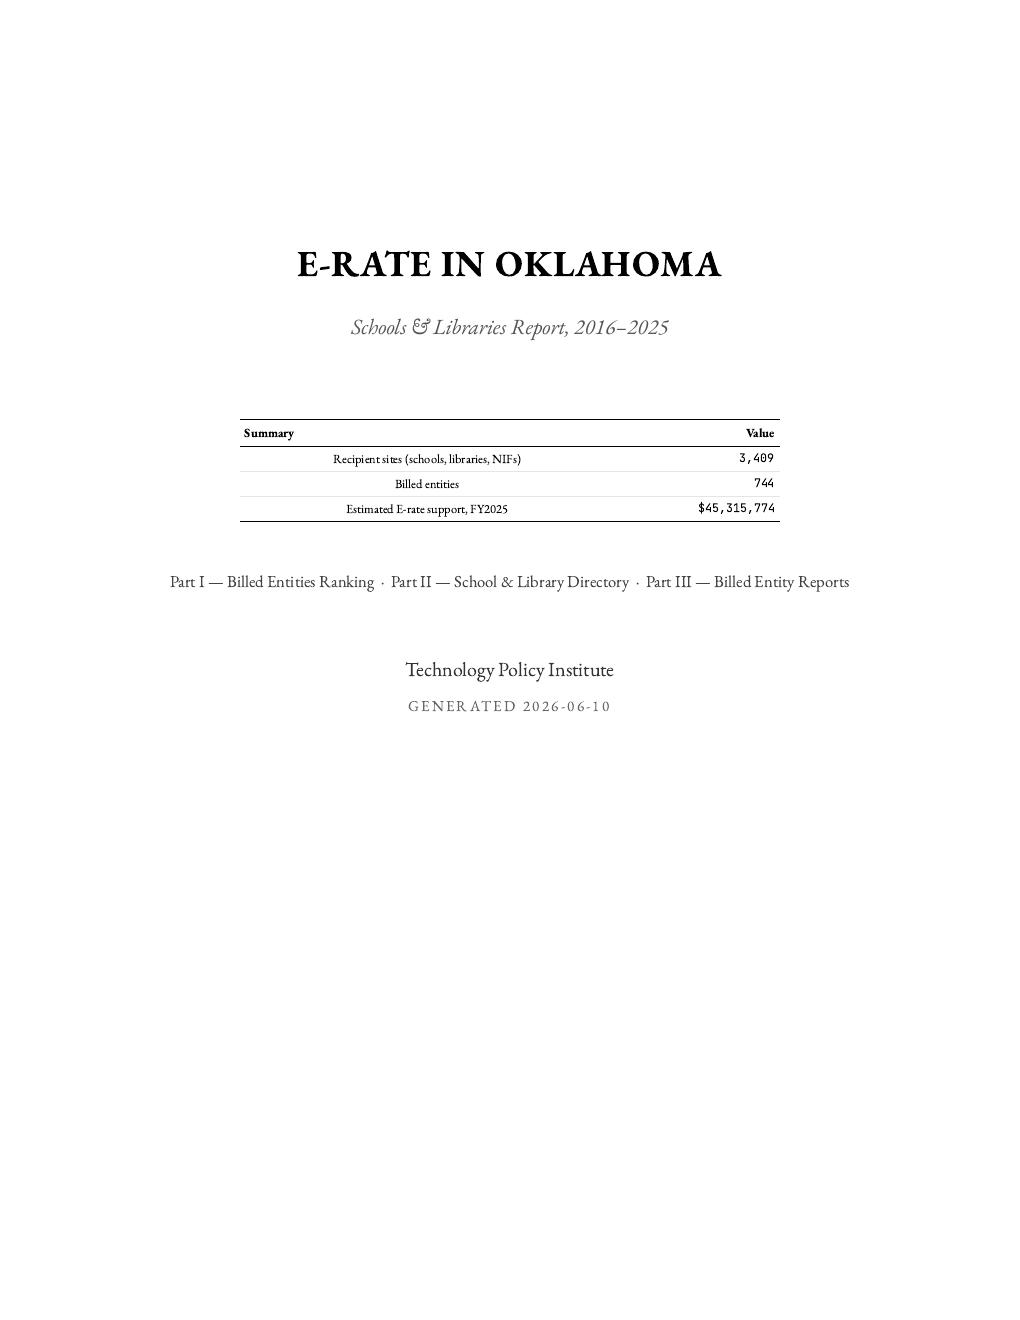
Oklahoma report cover
Oklahoma
2,032 pages · 3,409 recipient sites
↓ Download PDFBrowse online →
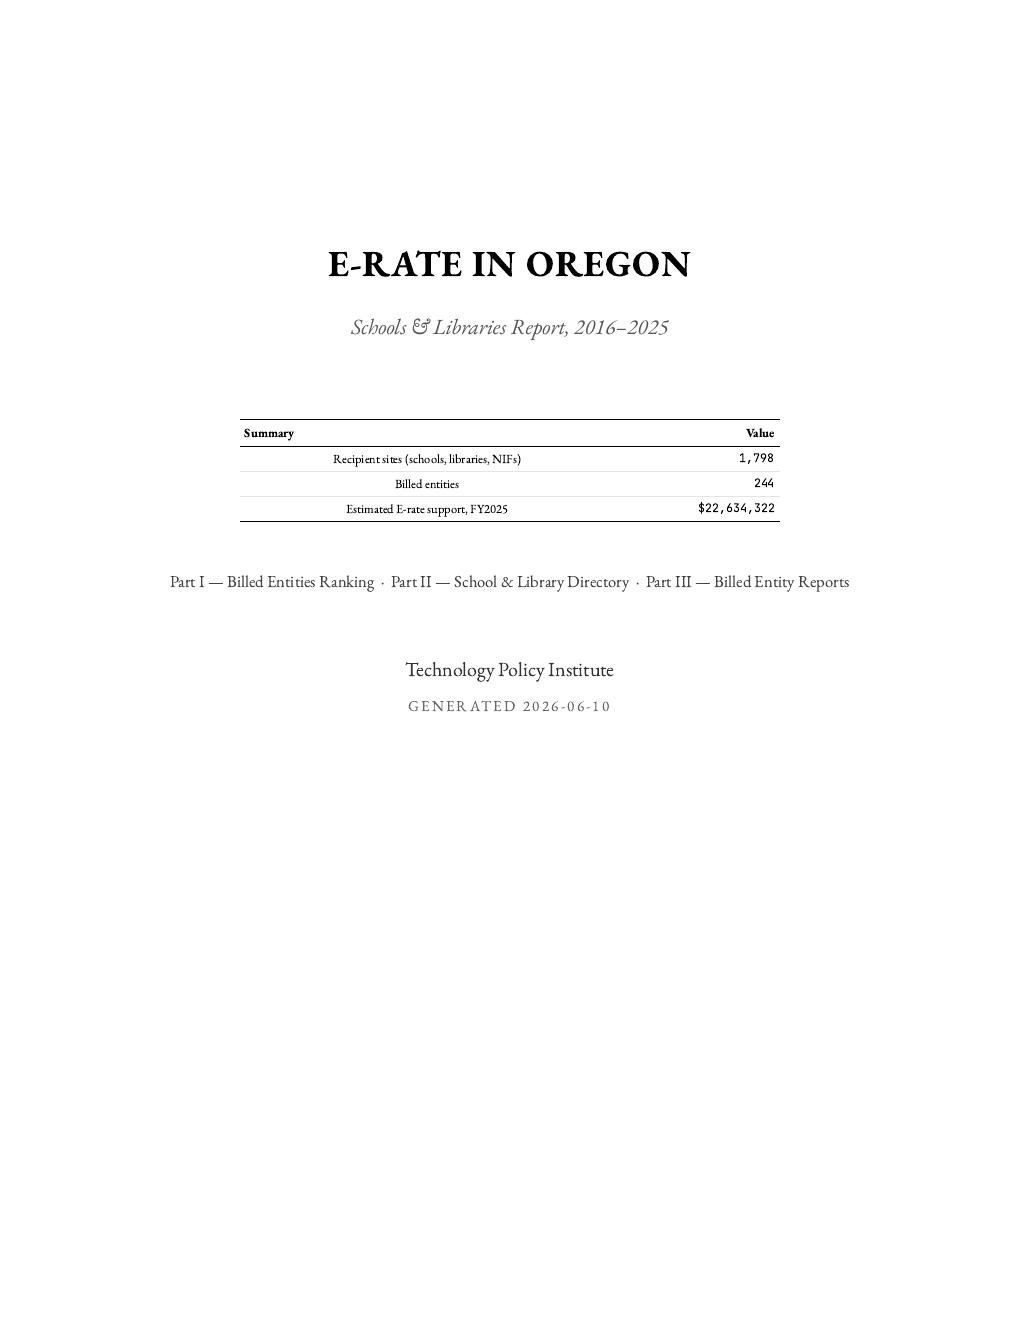
Oregon report cover
Oregon
666 pages · 1,798 recipient sites
↓ Download PDFBrowse online →
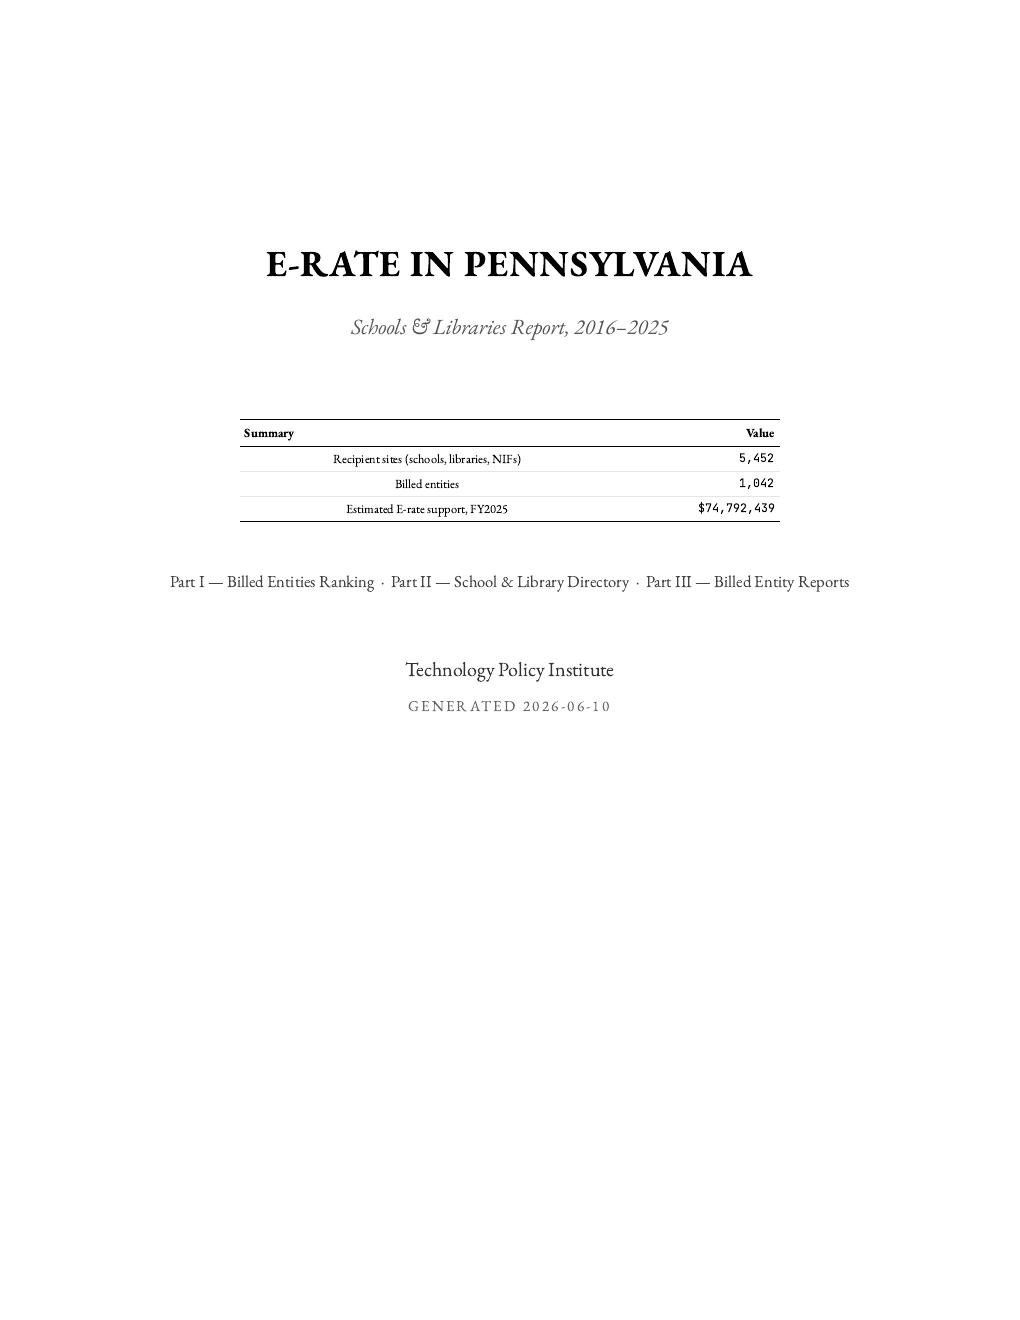
Pennsylvania report cover
Pennsylvania
2,628 pages · 5,452 recipient sites
↓ Download PDFBrowse online →
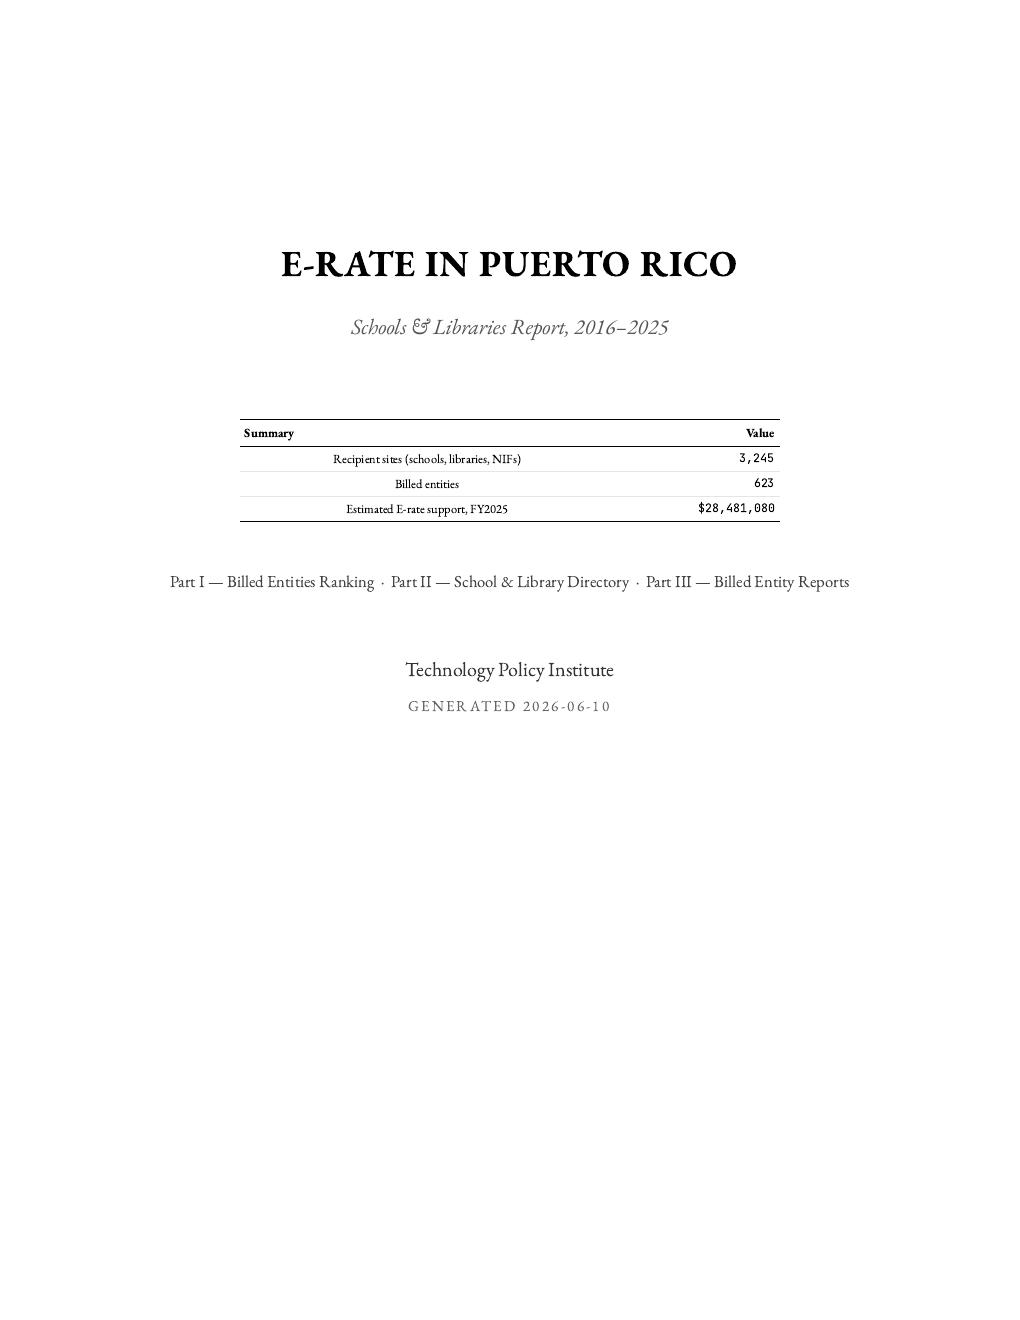
Puerto Rico report cover
Puerto Rico
1,098 pages · 3,245 recipient sites
↓ Download PDFBrowse online →
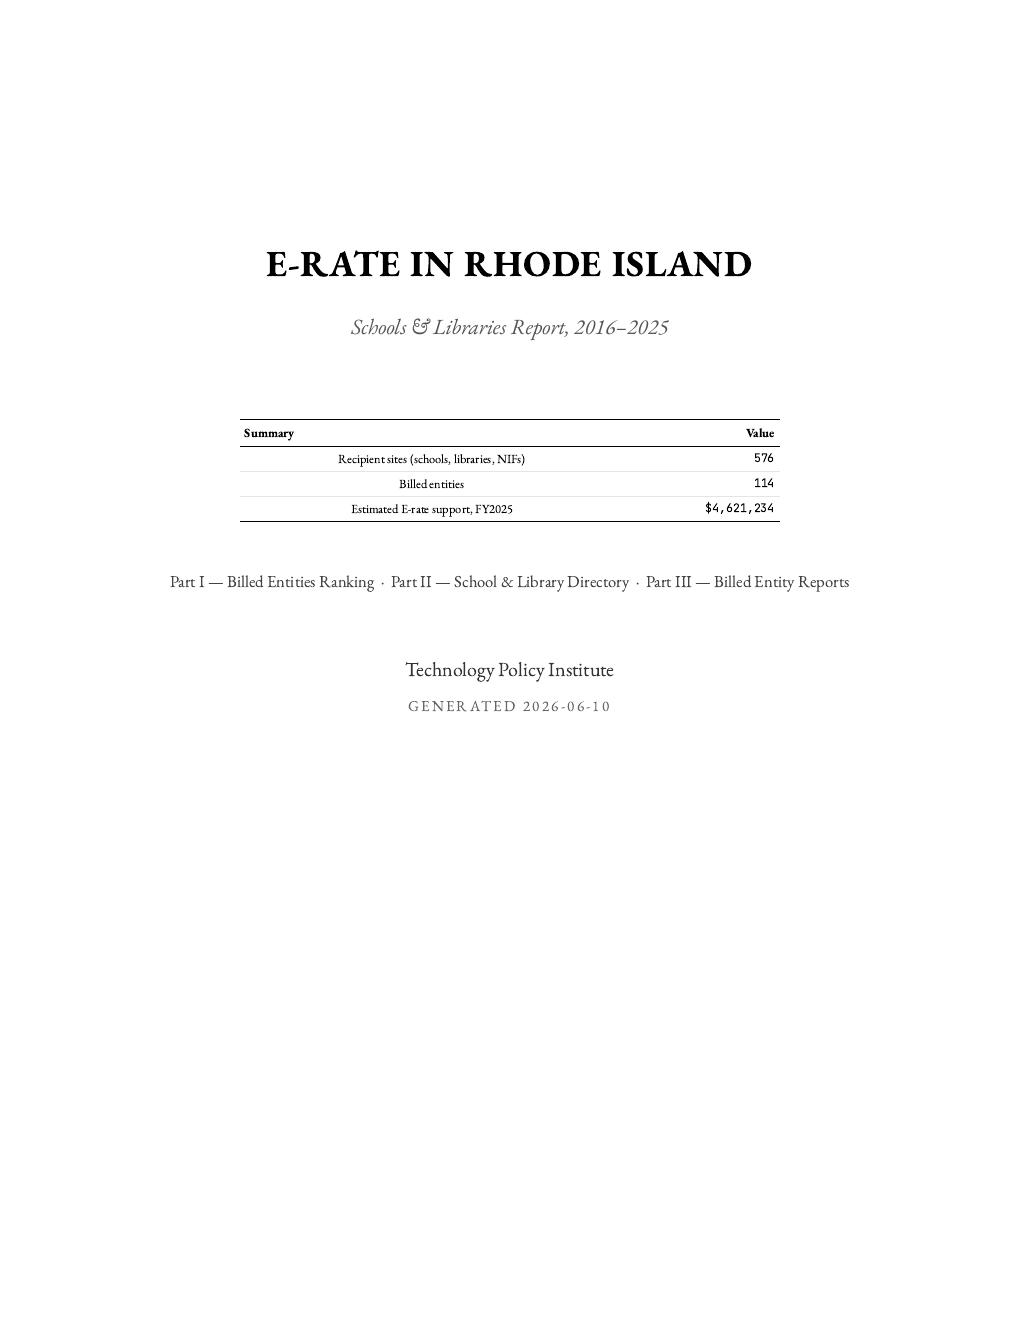
Rhode Island report cover
Rhode Island
280 pages · 576 recipient sites
↓ Download PDFBrowse online →
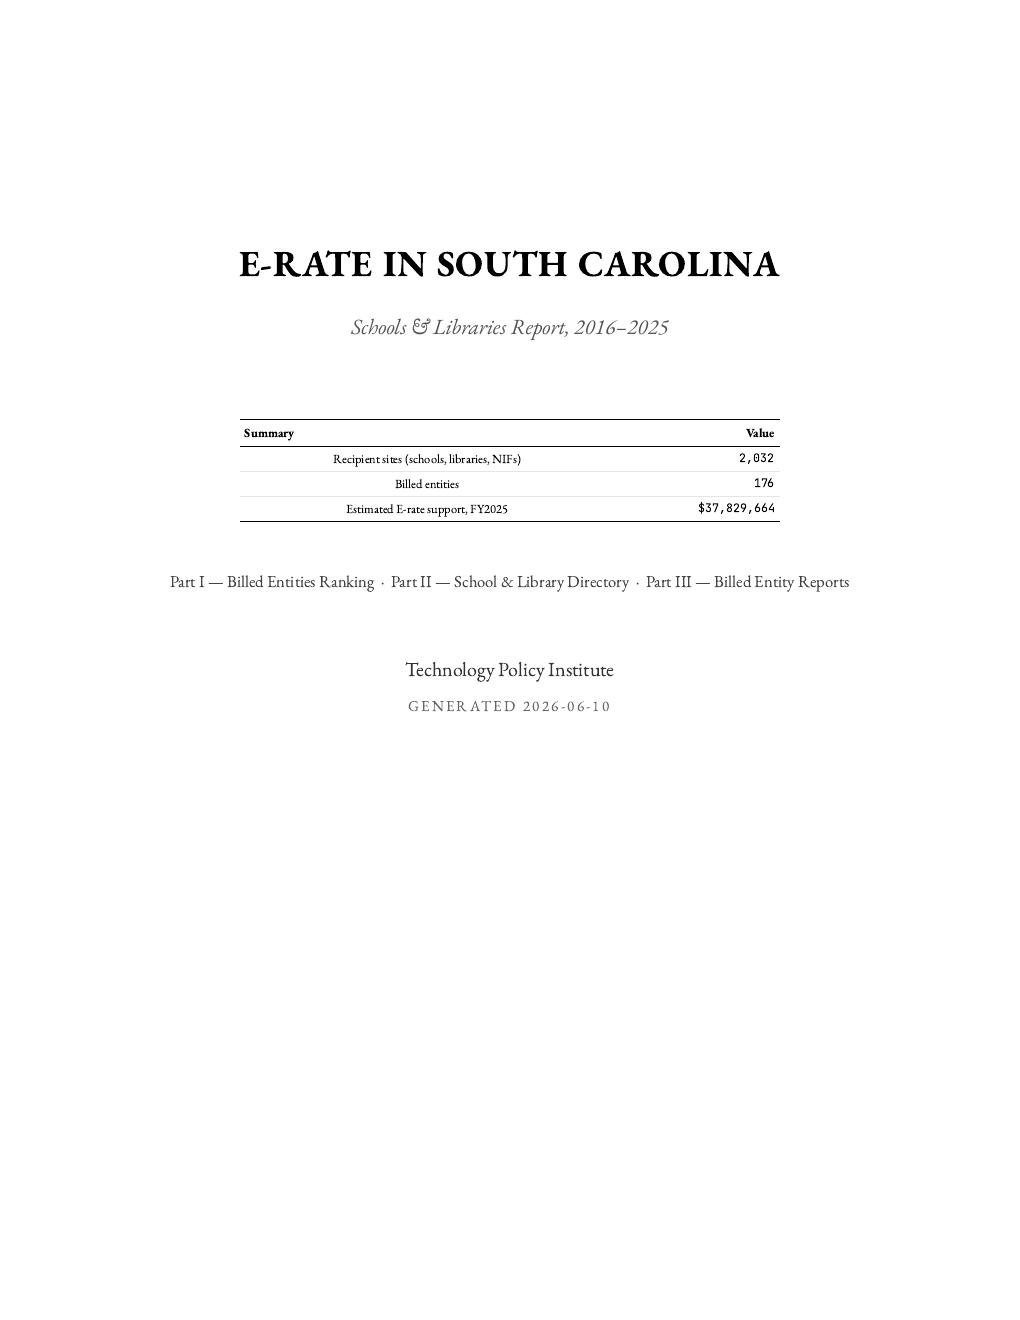
South Carolina report cover
South Carolina
506 pages · 2,032 recipient sites
↓ Download PDFBrowse online →
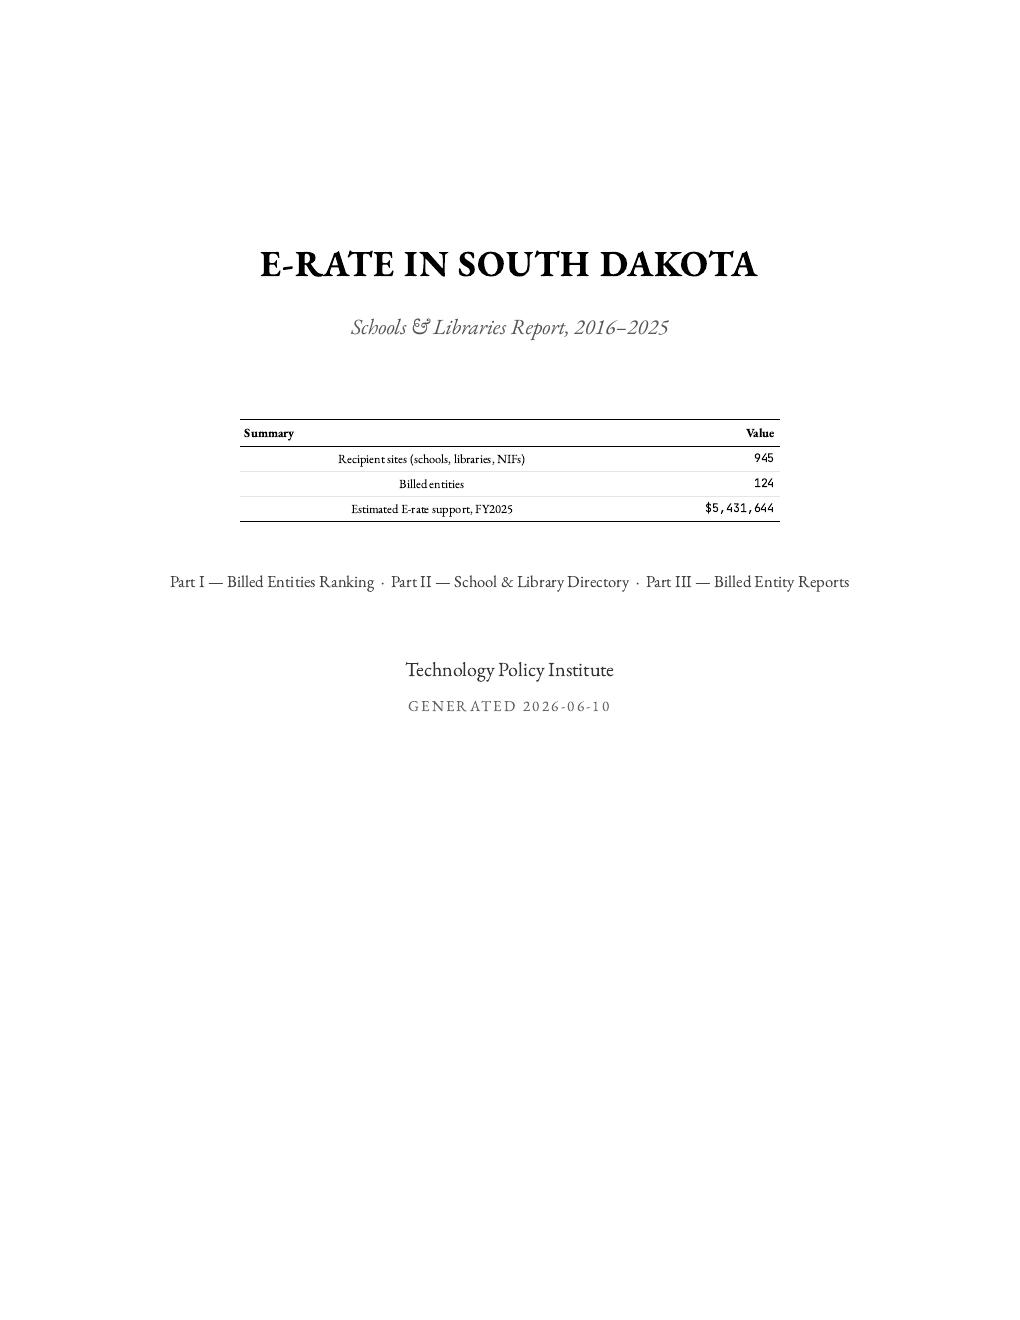
South Dakota report cover
South Dakota
348 pages · 945 recipient sites
↓ Download PDFBrowse online →
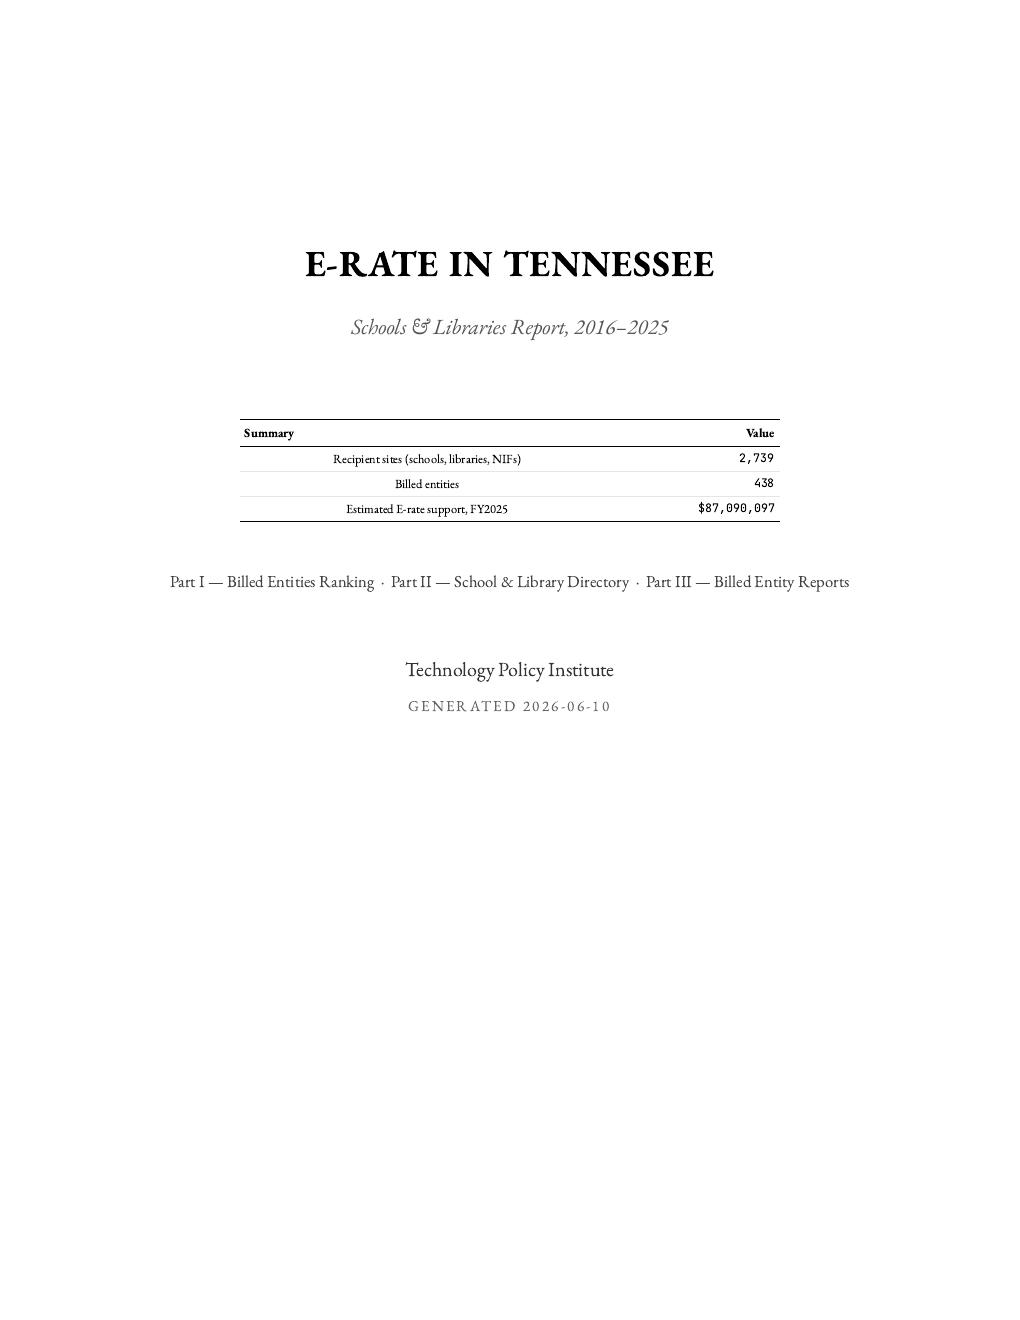
Tennessee report cover
Tennessee
1,051 pages · 2,739 recipient sites
↓ Download PDFBrowse online →
Texas — Central report cover
Texas — Central
1,244 pages · 3,179 recipient sites
↓ Download PDFBrowse online →
Texas — North report cover
Texas — North
2,184 pages · 6,228 recipient sites
↓ Download PDFBrowse online →
Texas — South report cover
Texas — South
1,346 pages · 4,519 recipient sites
↓ Download PDFBrowse online →
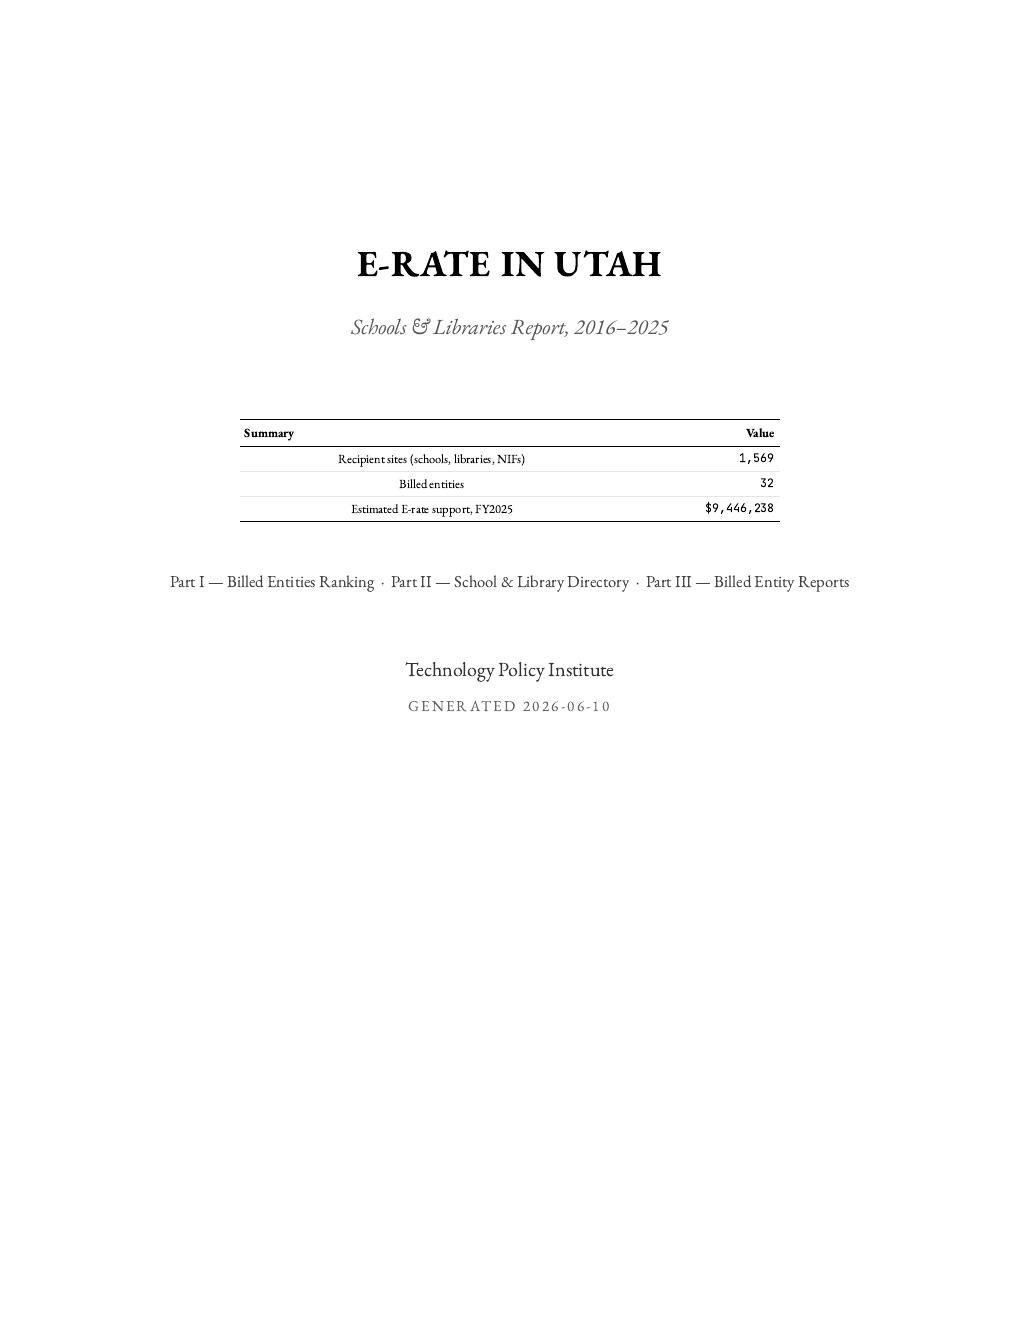
Utah report cover
Utah
171 pages · 1,569 recipient sites
↓ Download PDFBrowse online →
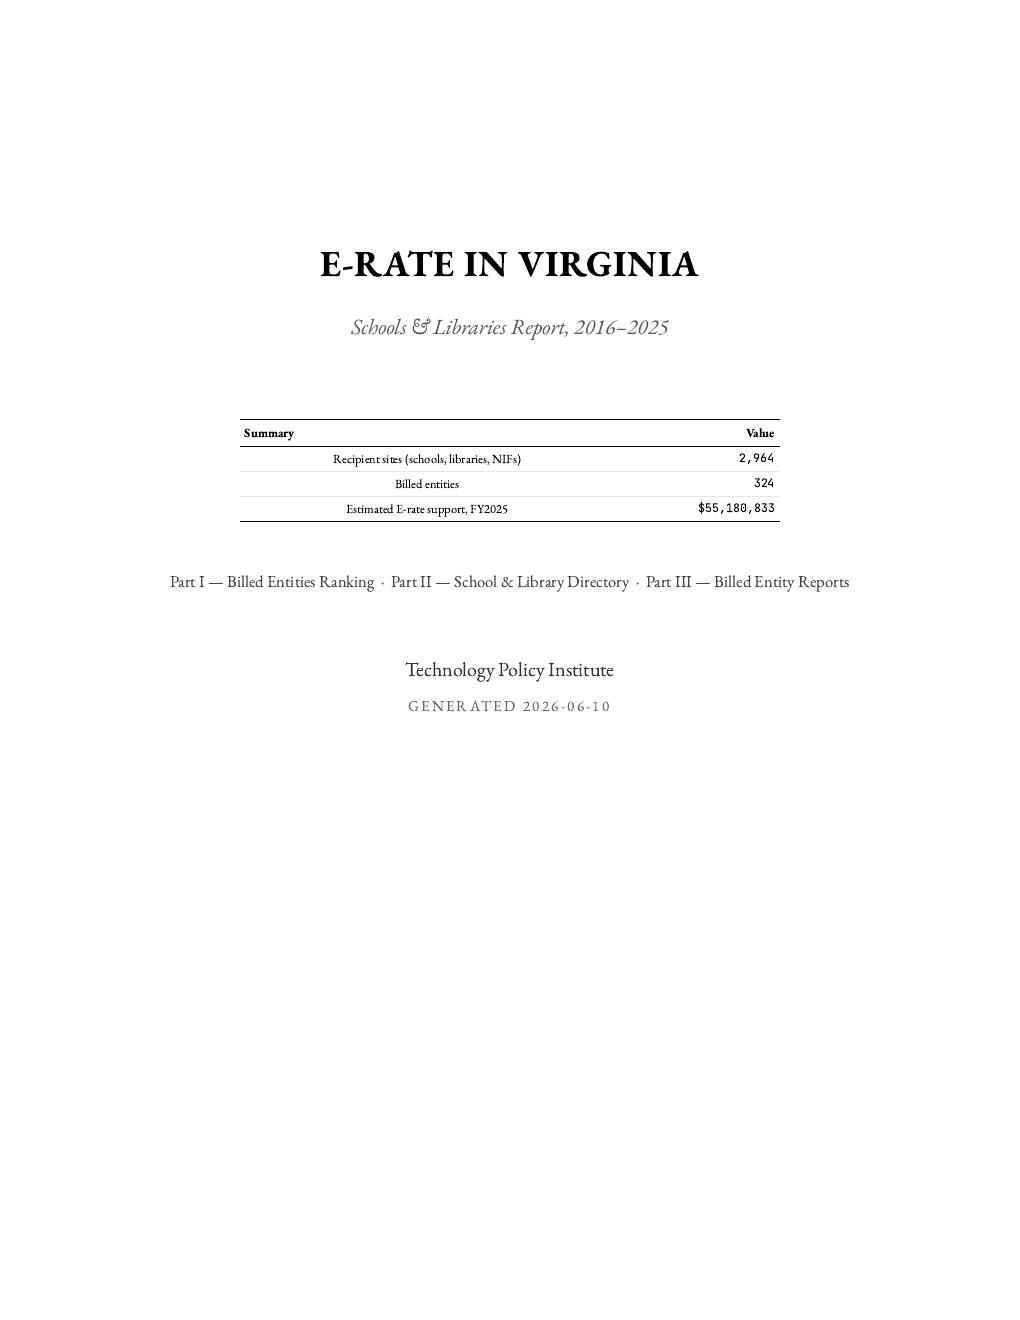
Virginia report cover
Virginia
924 pages · 2,964 recipient sites
↓ Download PDFBrowse online →
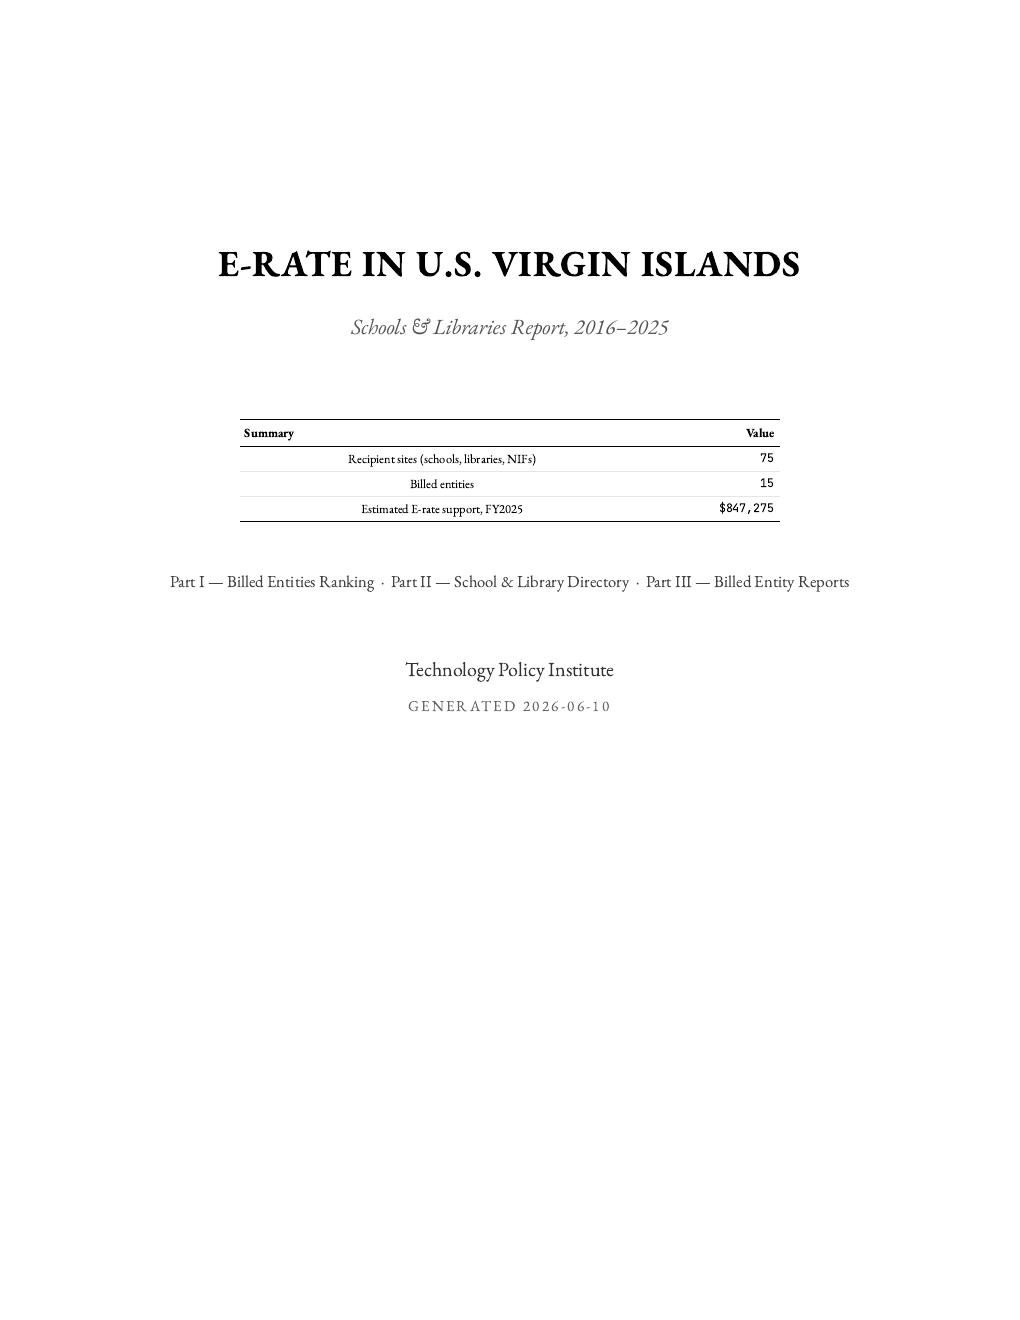
U.S. Virgin Islands report cover
U.S. Virgin Islands
39 pages · 75 recipient sites
↓ Download PDFBrowse online →
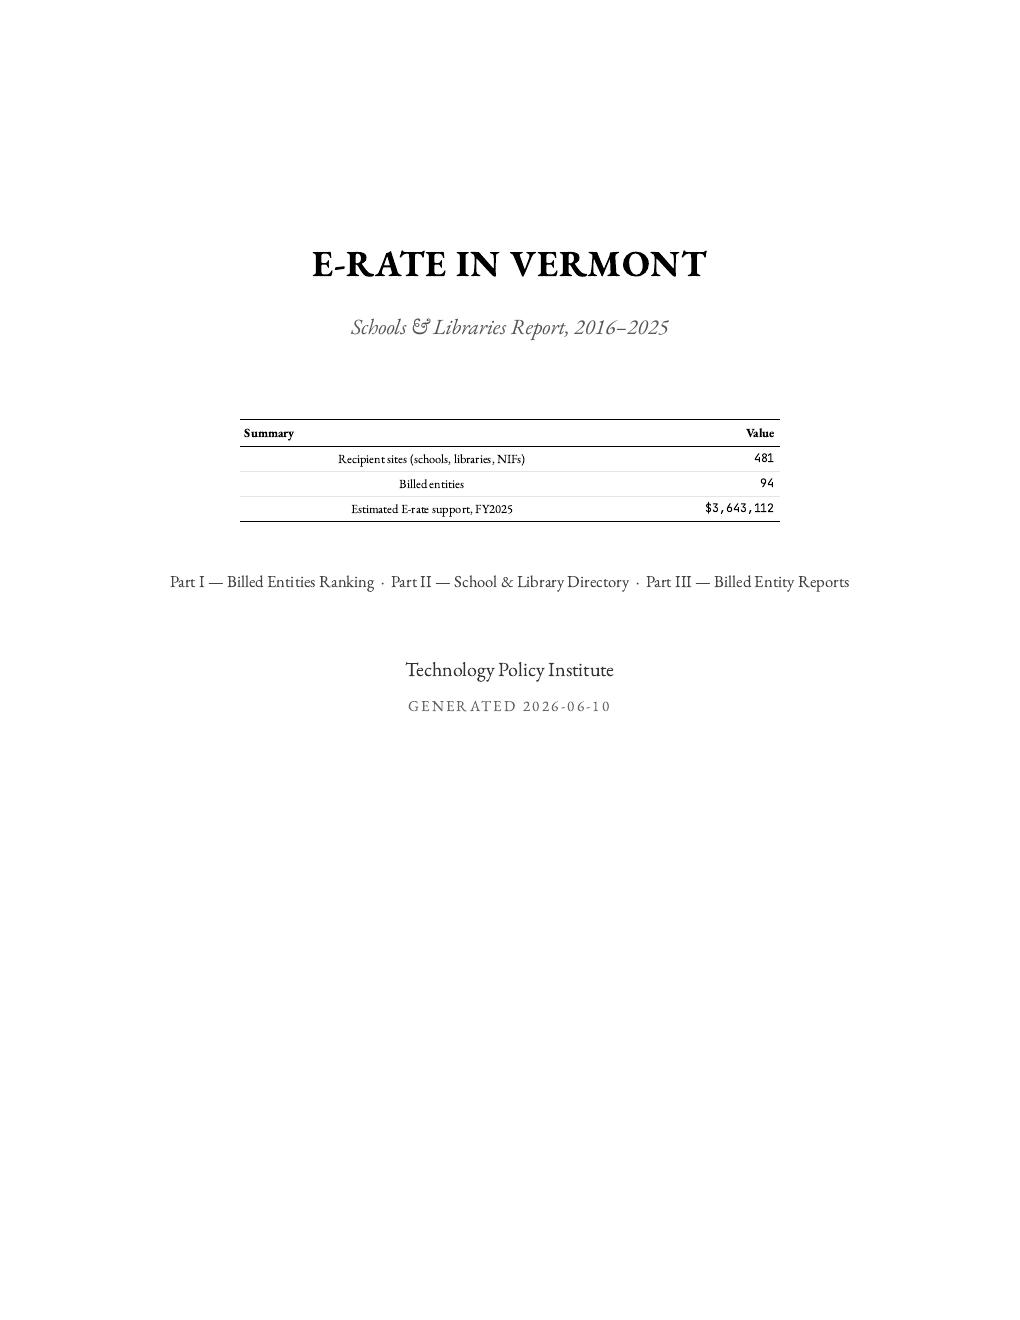
Vermont report cover
Vermont
235 pages · 481 recipient sites
↓ Download PDFBrowse online →
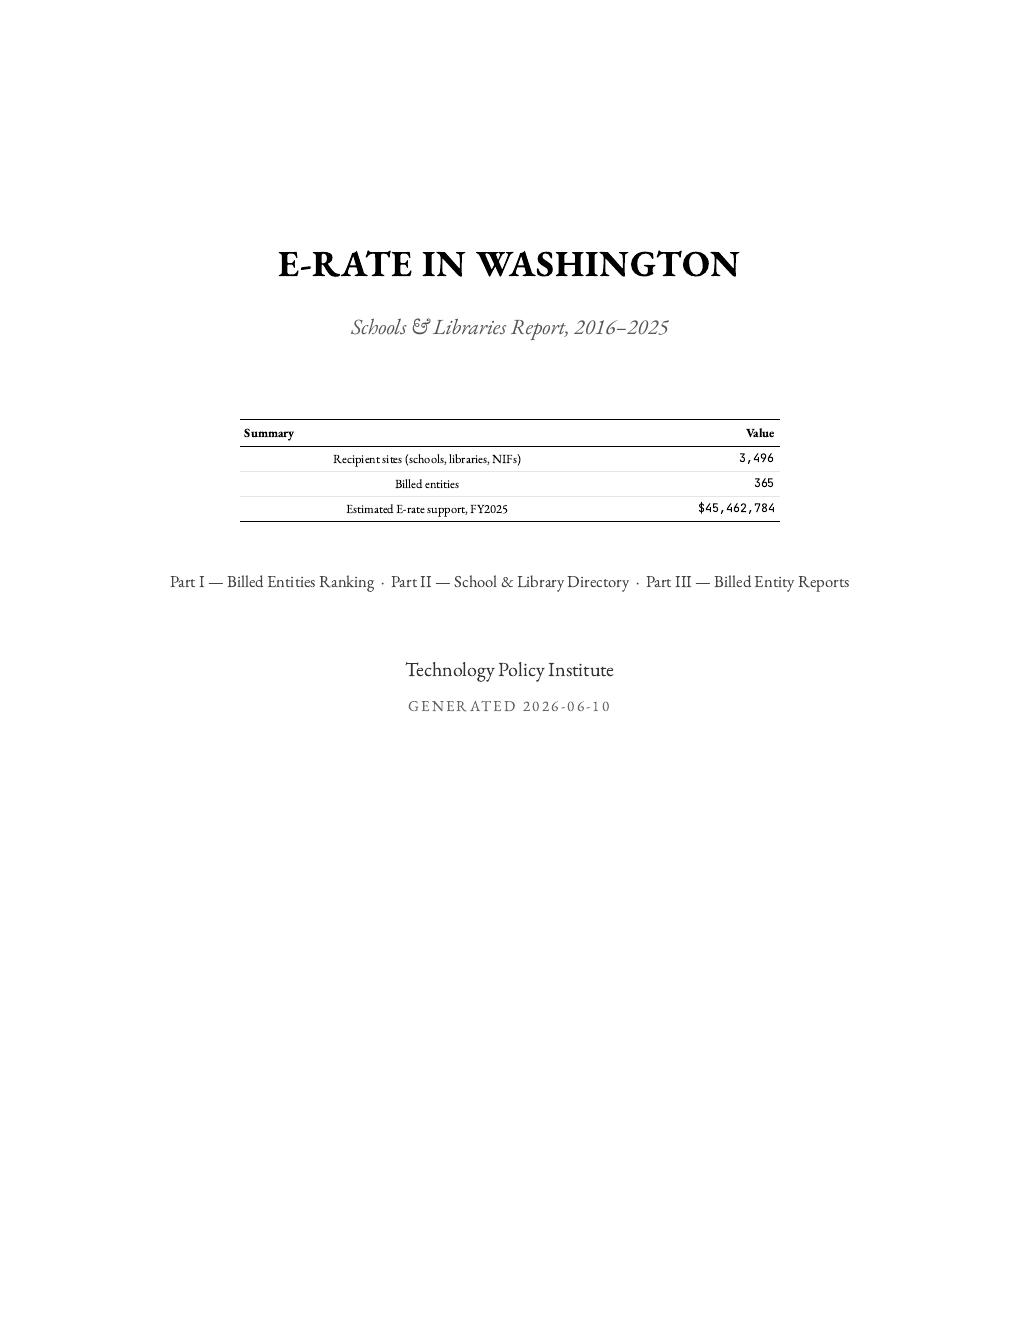
Washington report cover
Washington
1,063 pages · 3,496 recipient sites
↓ Download PDFBrowse online →
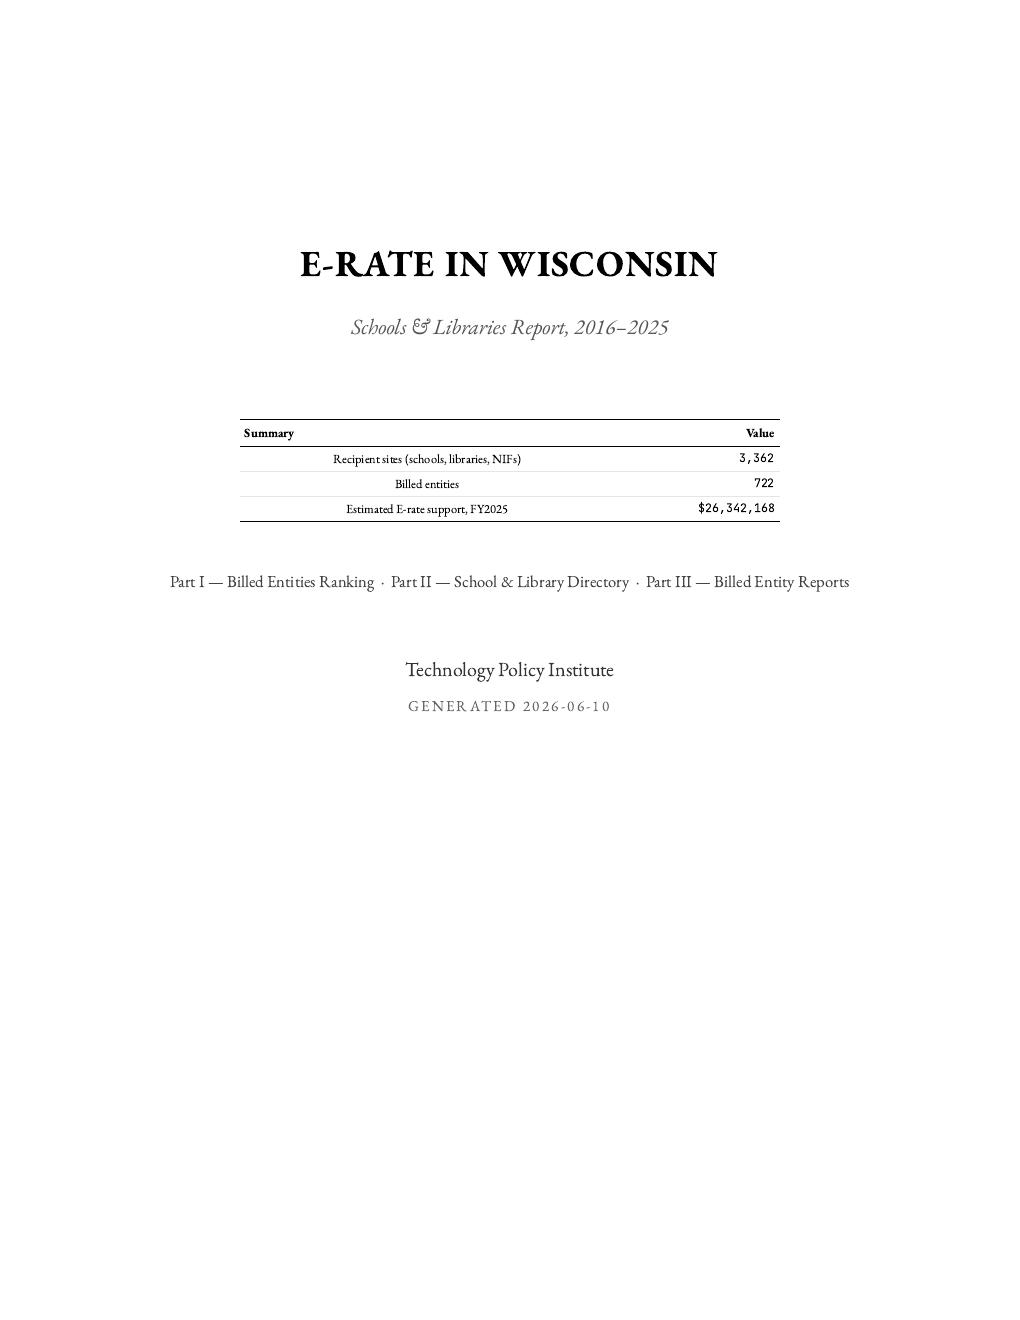
Wisconsin report cover
Wisconsin
1,786 pages · 3,362 recipient sites
↓ Download PDFBrowse online →
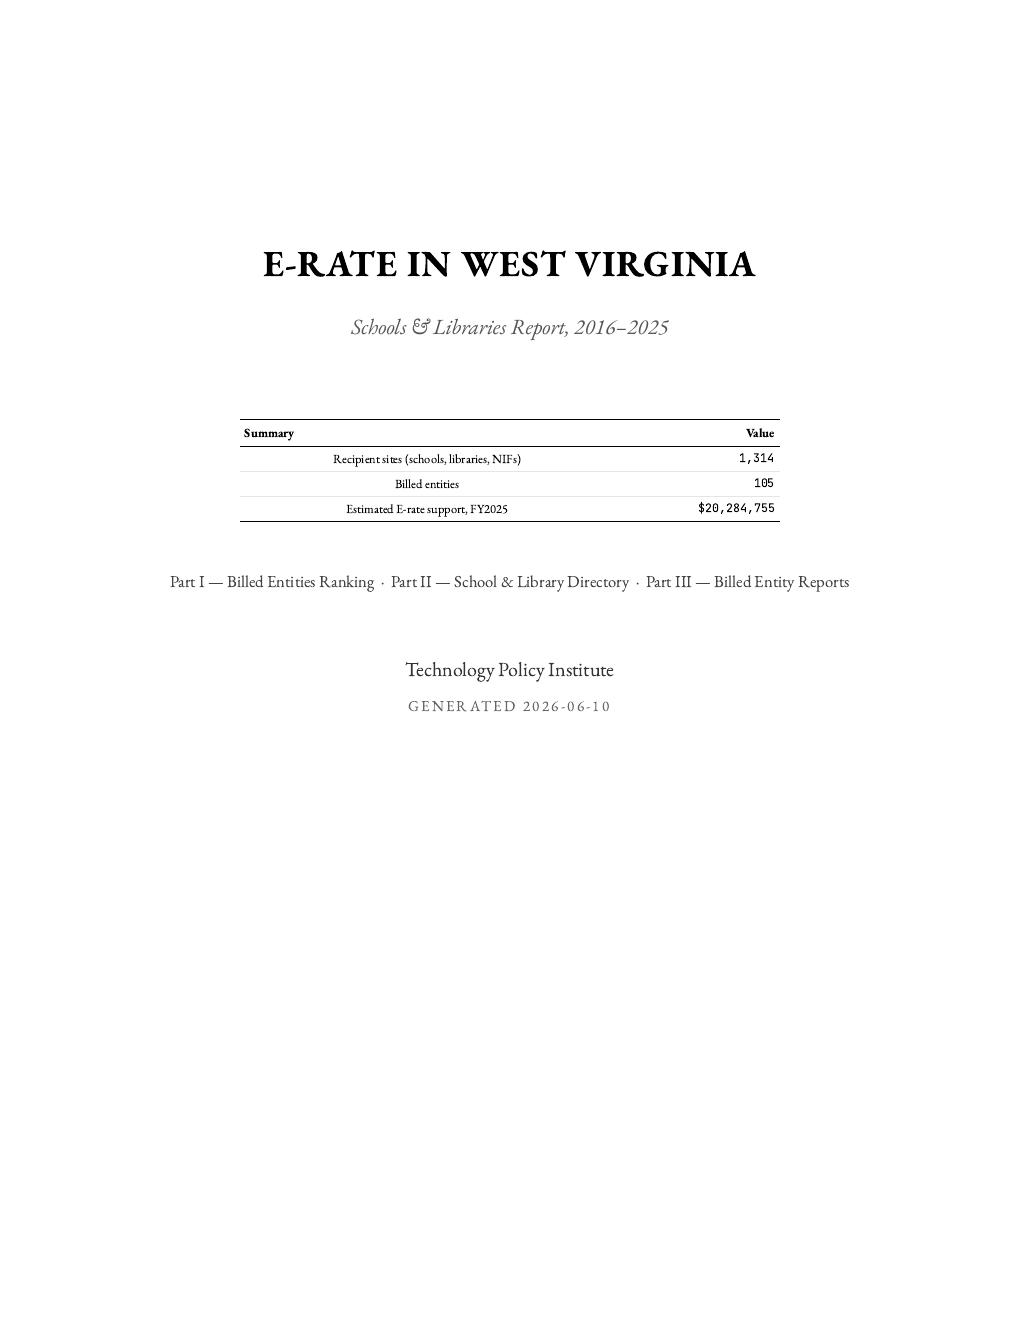
West Virginia report cover
West Virginia
338 pages · 1,314 recipient sites
↓ Download PDFBrowse online →
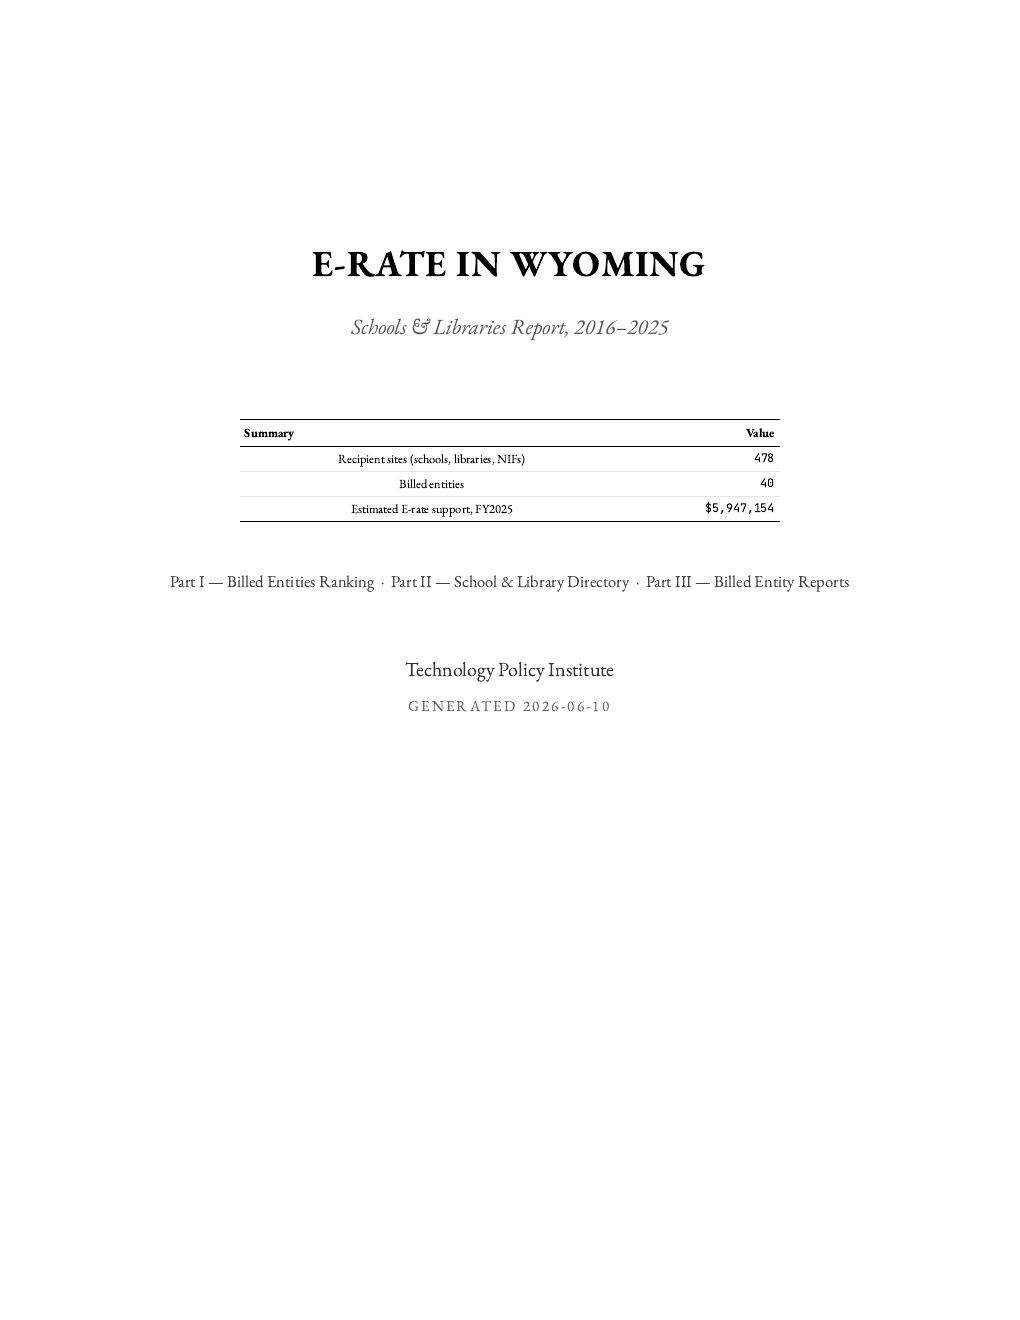
Wyoming report cover
Wyoming
128 pages · 478 recipient sites
↓ Download PDFBrowse online →

Sources

Primary datasets — USAC Open Data (opendata.usac.org)

All funding figures come from two public datasets maintained by the Universal Service Administrative Company (USAC), the nonprofit administrator of the E-Rate program under FCC oversight.

E-Rate Recipient Details and Commitments (avi8-svp9) is the primary record of every E-Rate funding commitment, covering FY2016–FY2025. Each row represents one service delivered to one recipient site under one Funding Request Number (FRN). Fields include the billed entity number, recipient organization, service type, committed amount, post-discount cost, connection speeds, and recipient coordinates. The dataset contains approximately 21.5 million rows across 11 funding years.

FCC Form 471 FRN Status (qdmp-ygft) tracks the lifecycle of every Funding Request Number from application through commitment and disbursement. The total_authorized_disbursement field — actual dollars approved for payment — is the measure used for all funding totals in this report. USAC continuously updates prior-year rows as invoices are processed, so the most recent one or two funding years always appear lower than their final totals; FY2025 invoices are still being paid as of this writing.

Historical data (FY1998–2015)

USAC's legacy commitment records for FY1998–FY2015 are no longer available on the public open-data portal. TPI downloaded and archived this dataset before it was removed; it now exists only in TPI's private BigQuery project and contains approximately 2.1 million rows. It provides the long historical baseline shown in the funding-history charts. Coverage varies — BEN-level totals are available for most of this period, but site-level recipient data becomes sparse before FY2010.

Key terms

Billed Entity Number (BEN) — the unique identifier USAC assigns to each organization that files an E-Rate application. A single school district, library system, or consortium is one BEN, even if it serves dozens of individual buildings. All funding figures are aggregated at the BEN level first, then rolled up to the congressional district or state. BEN-level totals represent the exact authorized disbursement to that organization; per-recipient-site figures are estimates derived by dividing each FRN line item's post-discount cost equally among the sites it covered.
Category 1 vs. Category 2 — E-Rate divides eligible services into two categories. Category 1 (C1) covers broadband connectivity and telecommunications services that bring internet access to a building: voice telephony, data transmission and internet access, and telecom services. Category 2 (C2) covers the internal network infrastructure needed to distribute that connectivity within a building: Wi-Fi access points, switches, routers, firewalls, and maintenance of those systems. C2 funding has been subject to per-student and per-square-foot budget caps since FY2015. The funding breakdowns in this report follow USAC's six service-type categories: Voice (C1), Telecom Services (C1), Data Transmission and/or Internet Access (C1), Internal Connections (C2), Basic Maintenance of Internal Connections (C2), and Managed Internal Broadband Services (C2).

Study Area Code (SAC) — a legacy identifier used by some telecom carriers in E-Rate filings to identify the geographic service territory of a particular circuit or connection. SACs appear in raw USAC data but are not surfaced in this report, which uses BENs and recipient-site coordinates as the primary geographic keys.

Geographic assignment

Each billed entity is assigned to a single congressional district — using 119th Congress boundaries from the U.S. Census Bureau TIGER/Line 2024 shapefiles — based on whichever district contains the largest number of that BEN's recipient sites, located by their USAC-reported coordinates. For BENs with no usable coordinates, the district listed in the organization's USAC profile is used as a fallback.

What is not included

FY2026 is excluded from all totals and charts because the funding year is still in progress — applications are still being reviewed and commitments are still being issued. The E-Rate invoices dataset (USAC jpiu-tj8h), which records actual disbursed dollars at the invoice level, was not used; all amounts here are authorized commitments from the FRN Status dataset, the standard measure used in E-Rate policy research.